

Time Analysis Powerpoint Presentation Slides




Try Before you Buy Download Free Sample Product
 Impress Your
 Audience
 100%
100% Editable
 Save Hours
 of Time


Identify time-consuming areas with our content ready Time Analysis Powerpoint Presentation Slides. The time management PowerPoint complete deck contains professionally designed slides such as guiding principle of time & self-management, employee weekly time schedule, workload prioritization chart, ways to reduce employee travel time, time utilization analysis, communication plan checklist, detailed communication plan, sources of workplace stress & negative impacts, impact & avoidance of procrastination at workplace, importance of workplace breaks, criteria table, prioritizing workload & key tasks, assignment table, priority task table, employee timesheet, goals & tasks, competency team skills matrix, employee tasks status table, task-based recognition table, employee time management evaluation chart, employee weekly efficiency dashboard, labour effectiveness dashboard, employee efficiency status KPI, etc. The biggest advantage of time optimization presentation deck is that it is fully editable in powerpoint, you can change the color text and font style without any hassle to suit your business needs. Download visually appealing time control PPT visuals to manage work activities effectively.Enhance commercial activity with our Time Analysis Powerpoint Presentation Slides. They are designed to bring your business into focus.
People who downloaded this PowerPoint presentation also viewed the following :
Content of this Powerpoint Presentation
Slide 1: This slide introduces Time Analysis. State your Company Name and get started.
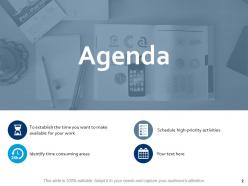
Slide 2: This slide showcases Agenda.
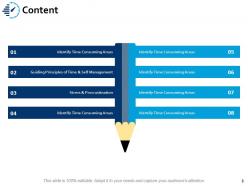
Slide 3: This slide presents Content with these of the following- Identify Time Consuming Areas, Guiding Principles of Time & Self Management.
Slide 4: This slide showcases Identify Time Consuming Areas.
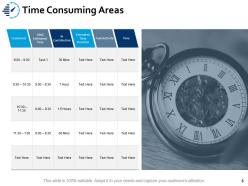
Slide 5: This slide presents Time Consuming Areas which further presents- Comments, Time, Task/Activity, Estimated Time Duration, % Contribution, Ideal, Estimated Time.
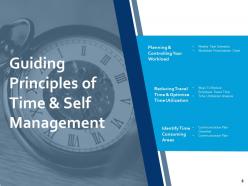
Slide 6: This slide showcases Planning & Controlling Your Workload which further presents- Reducing Travel Time & Optimize Time Utilization, Identify Time Consuming Areas, Weekly Task Schedule, Workload Prioritization Chart, Ways To Reduce Employee Travel Time, Time Utilization Analysis, Communication Plan Checklist, Communication Plan.
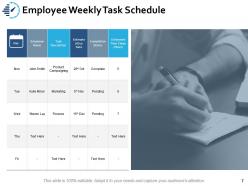
Slide 7: This slide presents Employee Weekly Task Schedule.
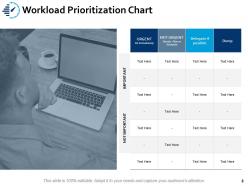
Slide 8: This slide showcases Workload Prioritization Chart.
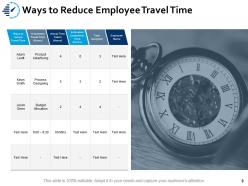
Slide 9: This slide presents Ways to Reduce Employee Travel Time which further presents these of the following- Ways to reduce Travel Time, Employee Name, Task, Assigned, Estimated Completion Time (Hours), Actual Time Taken (Hours), In between Travel Time (Hours).
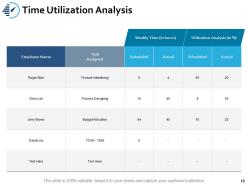
Slide 10: This slide showcases Time Utilization Analysis with these of the following- Weekly Time (in hours), Utilization Analysis (in %).
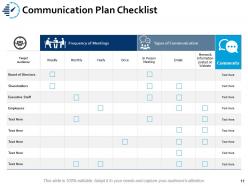
Slide 11: This slide presents Communication Plan Checklist.
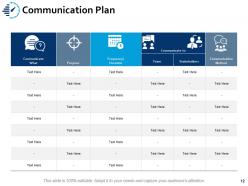
Slide 12: This slide showcases Communication Plan.
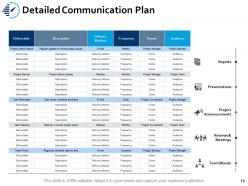
Slide 13: This slide presents Detailed Communication Plan which further showcases- Reports, Presentations, Project Announcements, Reviews & Meetings, Team Morale.
Slide 14: This slide showcases Stress & Procrastination with these of the following- Sources of Stress, Negative Impacts of Stress, Procrastination.
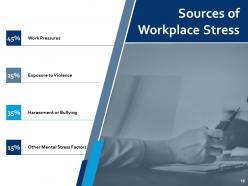
Slide 15: This slide presents Sources of Workplace Stress which further shows- Work Pressures, Exposure to Violence, Harassment or Bullying, Other Mental Stress Factors, Sources of Workplace Stress.
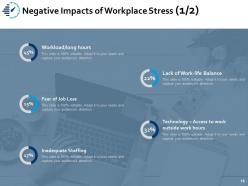
Slide 16: This slide showcases which Negative Impacts of Workplace Stress (1/2) which further shows- Lack of Work-life Balance, Technology – Access to work outside work hours, Workload/long hours, Inadequate Staffing, Fear of Job Loss.
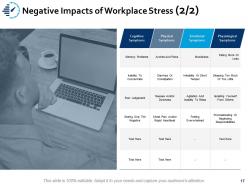
Slide 17: This slide presents Negative Impacts of Workplace Stress (2/2) which further presents- Cognitive Symptoms, Physical Symptoms, Emotional Symptoms, Physiological Symptoms.
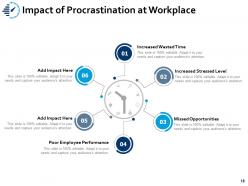
Slide 18: This slide shows Impact of Procrastination at Workplace which futher showcases Increased Wasted Time, Increased Stressed Level, Missed Opportunities, Poor Employee Performance.
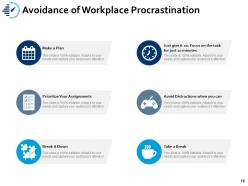
Slide 19: This slide showcases Avoidance of Workplace Procrastination with these of the following- Make a Plan, Prioritize Your Assignments, Break it Down, Just give it 10. Focus on the task for just 10 minutes, Avoid Distractions when you can, Take a Break.
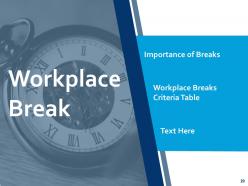
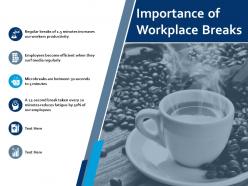
Slide 20: This slide shows Importance of Breaks with these of the following- Workplace Breaks Criteria Table, Workplace Break.
Slide 21: This slide showcases importance of workplace.
Slide 22: This slide presents Workplace Breaks Criteria Table.
Slide 23: This slide showcases Prioritizing Workload & Key Tasks with these of the followimg- Key Assignments Tasks Table, Priority Task Table.
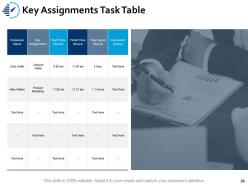
Slide 24: This slide showcases Key Assignments Task Table.
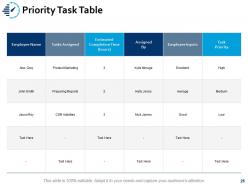
Slide 25: This slide presents Priority Task Table.
Slide 26: This slide showcases Employee Timesheet which further showcases- Planning & Prioritizing Projects, Goals & Tasks, Planning & Prioritizing Your Own Workload.
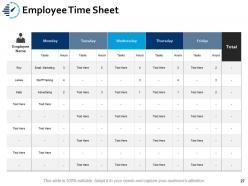
Slide 27: This slide presents Employee Time Sheet which further showcases Employee Name.
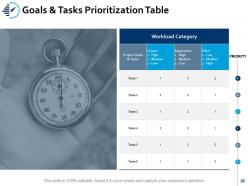
Slide 28: This slide showcases Goals & Tasks Prioritization Table.
Slide 29: This slide presents Task Assignment & Evaluation which further presents- Team Skills Matrix, Competency Team Skills Matrix, Project Team Skills Matrix, Team Skills Matrix Analysis Team Based Evaluation, Employee Task Status Table, Task Based Recognition Chart, Employee Time Management Evaluation Chart.
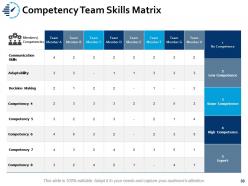
Slide 30: This slide shows Competency Team Skills Matrix which further showcases Members, Competencies.
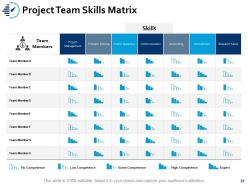
Slide 31: This slide showcases Project Team Skills Matrix which further presents- Skills, No Competence, Low Competence, Some Competence, High Competence, Expert, Team Members.
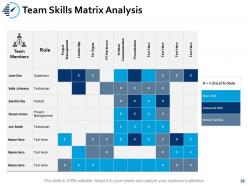
Slide 32: This slide presents Team Skills Matrix Analysis which further presents Team Members.
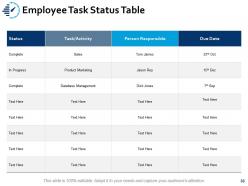
Slide 33: This slide showcases Employee Task Status Table.
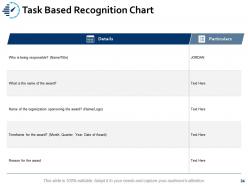
Slide 34: This slide presents Task Based Recognition Chart with these of the following- Details , Particulars.
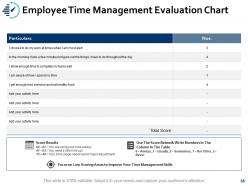
Slide 35: This slide showcases Employee Time Management Evaluation Chart.
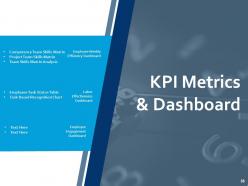
Slide 36: This slide showcases KPI Metrics & Dashboard which showcases Employee Weekly Efficiency Dashboard, Competency Team Skills Matrix, Project Team Skills Matrix, Team Skills Matrix Analysis, Labor Effectiveness Dashboard, Employee Task Status Table, Task Based Recognition Chart, Employee Engagement Dashboard.
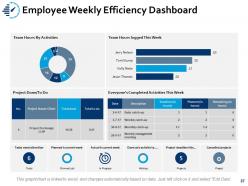
Slide 37: This slide showcases Employee Weekly Efficiency Dashboard which further presents- Team Hours logged This Week, Team Hours By Activities, Everyone’s Completed Activities This Week, Project Done/To Do, Tasks need attentio, Tasks, Planned h current week, Planned 75h, Actual h current week, In Progress, Done w/o activity ty…., Waiting, Project deadline this…, Projects, Cancelled projects, Project
Slide 38: This slide presents Labour Effectiveness Dashboard.
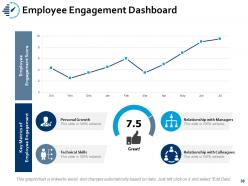
Slide 39: This slide showcases Employee Engagement Dashboard with these of the following parameters Employee Engagement Score, Key Metrics of Employee Engagement, Personal Growth, Technical Skills, Relationship with Managers, Relationship with Colleagues.
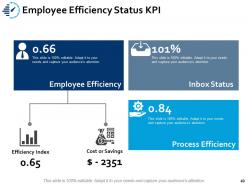
Slide 40: This slide presents Employee Efficiency Status KPI.
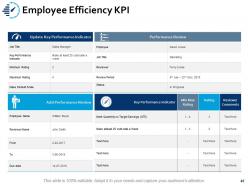
Slide 41: This slide shows Employee Efficiency KPI.
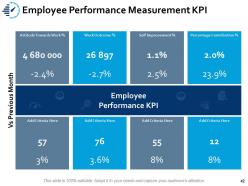
Slide 42: This slide presents Employee Performance Measurement KPI.
Slide 43: This slide shows Time Analysis Icons Slide.
Slide 44: This slide is titled Additional Slides.
Slide 45: This slide presents Our Mission.
Slide 46: This slide showcases Our Team with Name and Designation to fill.
Slide 47: This is an About Us slide. State company or team specifications here.
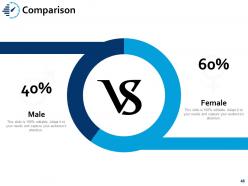
Slide 48: This slide shows Comparison of Positive Factors v/s Negative Factors with thumbs up and thumb down imagery.
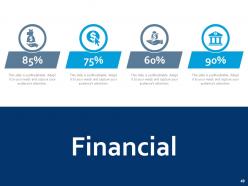
Slide 49: This is a Financial Score slide to show financial aspects here.
Slide 50: This is a Quotes slide to convey message, beliefs etc.
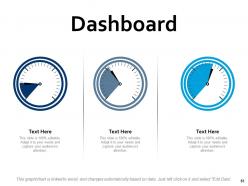
Slide 51: This is a Dashboard slide to show- Strategic System, Success, Goal Process, Sales Review, Communication Study.
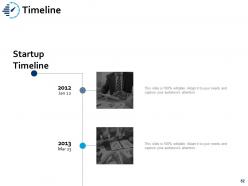
Slide 52: This slide shows Startup Timeline.
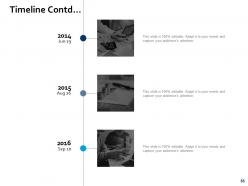
Slide 53: This slide presents Timeline Contd.
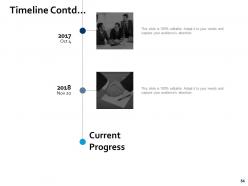
Slide 54: This slide showcases Timeline Contd.
Slide 55: This slide shows an image with text boxes titled Business Person with Post It notes.
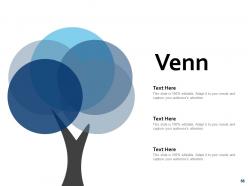
Slide 56: This is a Venn diagram image slide to show information, specifications etc
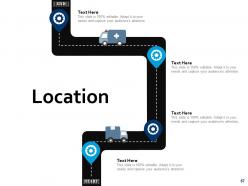
Slide 57: This is a Location slide to show global growth, presence etc. on world map.
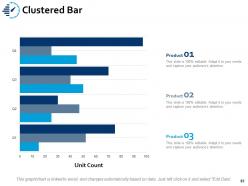
Slide 58: This slide presents Clustered Bar.
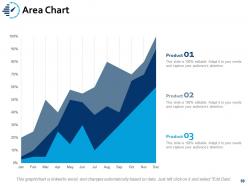
Slide 59: This slide showcases Area Chart.
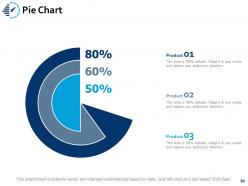
Slide 60: This slide presents Pie Chart.
Slide 61: This slide showcases Clustered Bar.
Slide 62: This is a Thank You image slide with Address, Email and Contact number.
Time Analysis Powerpoint Presentation Slides with all 62 slides:
Use our Time Analysis Powerpoint Presentation Slides to effectively help you save your valuable time. They are readymade to fit into any presentation structure.










FAQs for Time Analysis
Okay so first thing - map out all your dependencies because that's honestly the foundation of everything. Then break your project into specific activities and estimate realistic timeframes for each one. Critical path analysis is where it gets interesting - it'll show you exactly which tasks can't be delayed without screwing up your entire timeline. Always add buffer time though, seriously, everything takes way longer than you think it will. Oh and don't worry about perfecting the time estimates right away, you can always adjust. Start with dependencies, then move to duration estimates. That order makes everything clearer.
Honestly, tracking time shows you where your team's energy actually disappears - usually not where you'd expect. Each person should log their week (Toggl works great for this). You'll catch which meetings are total wastes and spot who's drowning in work while others coast. The "quick interruption" thing is brutal - I swear those 2-minute questions somehow eat entire afternoons. Once everyone sees their own data laid out, people naturally start being more mindful about time without you having to nag them. Just one week of tracking reveals crazy patterns.
Honestly, start with Toggl or RescueTime - they track everything automatically which is huge. Excel or Google Sheets are perfect if you want to dig deeper into the data yourself. Tableau's amazing for fancy charts but only if your company already has it (otherwise it's pricey). Clockify and Harvest are solid choices too, especially since they play nice with most project management tools. But here's the thing - pick whatever you'll actually stick with. I've seen people get the "perfect" setup and then never use it. Better to start basic and upgrade once you've got good data coming in. Trust me on this one.
Don't track for just a day or two - that's useless. You need at least a week, maybe more, to spot actual patterns. Here's what I learned the hard way: write down your energy levels and interruptions too, not just tasks. Are you actually productive or just running around feeling busy? There's a huge difference. Oh, and don't judge yourself while you're doing this - you'll start acting weird and mess up the data. Once you've got solid info, find your peak hours and biggest time wasters. Then change one thing at a time.
Honestly, tracking time shows you where your hours *actually* go vs where you think they do. I was shocked when I first did this - so much time on random stuff that doesn't matter! You'll spot bottlenecks and see which tasks actually move the needle. Plus you get real data instead of just guessing about what's productive. Track your biggest projects for like two weeks and watch the patterns pop up. Then you can figure out what processes suck, who needs help, and where to focus next. It's kind of annoying to do but totally worth it.
Track these four things: how long tasks actually take vs your estimates, your utilization rate (productive hours vs just being busy), how often you switch between tasks, and whether you hit deadlines. That utilization one's honestly the most eye-opening - I used to think scrolling through emails counted as work lol. Also figure out when you're sharpest during the day. Together these show you where your time really goes instead of where you think it does. Don't go crazy though - just pick one metric and track it for a week first.
Honestly, tracking time shows you who's actually drowning vs who has bandwidth you never knew existed. Have everyone log their hours for like two weeks - the patterns will smack you in the face. You'll spot where work gets stuck and which tasks take forever for certain people. The uneven distribution is wild once you see it on paper. Then you can actually move stuff around based on real data instead of guessing. Oh, and it's great for figuring out who needs training on what. Super eye-opening exercise.
Honestly, just break everything down into actual tasks first - like really granular stuff. Look back at old projects to see where you always mess up the timing (spoiler: probably everywhere lol). I always add 20-30% extra time because something will go wrong. Could be your client changing their mind, or some random technical nightmare you didn't see coming. Don't pick dates that just sound good to your boss either. Be real about what your team can actually handle. Map it all out, estimate on the conservative side, then pad it. Trust me on this one.
Basically you're tracking velocity and story points to figure out what your team can actually ship each sprint. Way better than waterfall's endless upfront planning nightmare. Historical sprint data becomes your crystal ball for forecasting capacity - plus it helps spot bottlenecks before they wreck everything. Burn-down charts and velocity trends show your team's actual delivery patterns (not what you hoped they'd be). Start with basic time tracking first. Don't overcomplicate it right away - add fancier metrics once everyone's comfortable with the basics.
Honestly, try logging what you do in 15-30 minute chunks for like a week. I know it sounds tedious but you'll probably be horrified at where your time actually disappears to! Look for the sneaky stuff - endless email refreshing, pointless meetings, getting sucked into random chats. Be real about what's actually helping you vs just making you feel productive. Once you spot your biggest time wasters, start setting some rules. Maybe check email twice a day max, or skip meetings that don't really need you there. Just start tracking tomorrow and see what patterns jump out by Friday.
So there's two ways to look at time analysis. Qualitative is about the *why* - like keeping time logs or noticing where your workflow gets stuck. Quantitative is just pure numbers and metrics. Most people go straight for the data because it feels more legit, but honestly that's backwards. You need the qualitative stuff first to figure out what's actually going wrong. Then you can measure it. Like, maybe you realize you're constantly interrupted during deep work (qualitative), then you track exactly how many times per day (quantitative). The combo works way better than either alone.
Honestly, timing your customer touchpoints is a game-changer for spotting where things get messy. Map out the whole journey and clock each step - you'll probably be shocked at how long some stuff takes. Response times, waiting periods, checkout flow... all of it. I swear, companies never realize how much dead time they're creating until they actually measure it. Once you've got the data, you can see exactly where people are getting frustrated and fix those specific bottlenecks. Maybe support tickets are sitting there for hours, or your checkout process is way too clunky. Set better expectations with customers too.
Honestly, continuous time analysis is like having a smoke detector for your business processes. You can't wait around for weekly reports when stuff's moving fast - by then whatever broke already cost you money. Real-time monitoring catches bottlenecks and resource issues right as they're happening, not three days later when it's too late. Picture driving on the highway but only checking your speed once an hour... terrible idea, right? Same logic here. I'd set up automated alerts for your main metrics so you're not glued to dashboards all day, but you'll still know immediately when something's off. Way better than playing catch-up constantly.
Don't make time analysis some big separate thing - just bake it into what you're already doing. Get automated tools running so your team doesn't have to log everything manually (because let's be real, they won't). Pick one process this week and start measuring it consistently. Monthly check-ins help catch problems before they spiral. Oh, and definitely cross-train a few people on this stuff - learned that one the hard way when our spreadsheet guru quit unexpectedly. The key is connecting your findings to metrics leadership actually gives a damn about. Otherwise you're just collecting data for fun.
Look, time analysis basically shows you where your money's actually going. If that developer needs 3 weeks instead of 1, boom - you're paying triple the labor costs. Pretty brutal wake-up call sometimes. It also shows you which tasks are gonna create bottlenecks, so you can put your strongest people there and move the less critical stuff around when everyone's free. Here's the thing though - you gotta track your actual hours against what you estimated from the start, otherwise you're just guessing the whole time.
-
Great quality product.
-
Awesomely designed templates, Easy to understand.
-
Awesome presentation, really professional and easy to edit.
-
Illustrative design with editable content. Exceptional value for money. Highly pleased with the product.
-
Great quality slides in rapid time.