

Fleet Vehicle Management System Dashboard




Try Before you Buy Download Free Sample Product
 Impress Your
 Audience
 100%
100% Editable
 Save Hours
 of Time


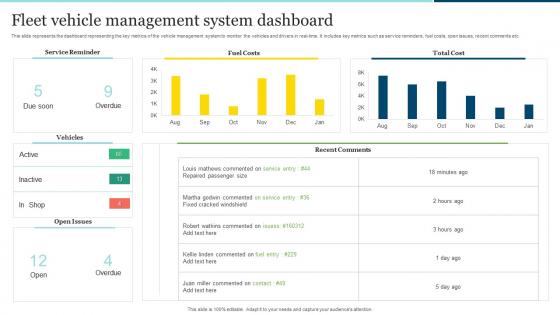
This slide represents the dashboard representing the key metrics of the vehicle management system to monitor the vehicles and drivers in real time. It includes key metrics such as service reminders, fuel costs, open issues, recent comments etc.
People who downloaded this PowerPoint presentation also viewed the following :
Fleet Vehicle Management System Dashboard with all 7 slides:
Use our Fleet Vehicle Management System Dashboard to effectively help you save your valuable time. They are readymade to fit into any presentation structure.





FAQs for Fleet Vehicle
Stick with the big five: vehicle utilization, fuel per mile, maintenance costs, driver scores, and route efficiency. I've seen way too many dashboards crammed with 20+ metrics that just sit there unused. Your utilization rate shows if trucks are sitting around doing nothing. Fuel and maintenance hit your profits directly - no brainer there. Driver performance helps with safety stuff and keeping regulators happy. Route efficiency catches all those inefficient paths that waste time and gas. Honestly, start simple with these core ones first. You can always pile on more metrics once your team actually gets into the habit of checking the dashboard regularly.
Dude, real-time data basically turns your fleet dashboard into mission control. Instead of waiting around for daily reports, you'll see everything as it happens - where trucks are, how drivers are doing, fuel usage, maintenance alerts. Pretty wild once you get used to it. You can jump on problems instantly, like dispatching whoever's closest for rush jobs or catching engine issues before they turn into expensive disasters. Honestly the route deviation alerts alone probably pay for themselves. I'd start by figuring out which live updates would solve your biggest daily headaches first.
Dude, GPS tracking is like the foundation for everything else in fleet management. Real-time locations, route planning, monitoring if your drivers are being crazy with the gas pedal or braking too hard. Without it you're basically guessing where everyone is all day. The cool part is how it automatically feeds into maintenance schedules and fuel reports - saves so much time. Your customers get actual delivery updates instead of "sometime today" which they love. Oh, and set up geofences first around your main spots. Trust me, it'll eliminate all those "did you make the delivery?" calls.
Honestly, predictive analytics is a game changer for fleet dashboards. It looks at your historical data and basically tells you what's coming - like when trucks need maintenance or which routes are gonna hit traffic. Super helpful for fuel cost spikes too. Your dashboard shows alerts and suggestions, so you can schedule maintenance early, switch routes on the fly, or time your fuel purchases better. I'd start with the maintenance predictions though - my buddy saved a ton doing that first. Oh, and the ROI on preventing breakdowns versus fixing them? Night and day difference.
So for fleet dashboards, put your most critical stuff right at the top - vehicle locations, alerts, fuel levels. Make sure it updates in real-time and don't cram everything onto one screen (seriously, those cluttered dashboards are useless). Color-code things intuitively - red for issues, green for all good. Interactive maps are a must. Oh, and customize different views for different people since dispatchers need totally different info than the executives do. I'd honestly just start with a rough mockup and test it with actual users first before you build anything fancy.
Look, these dashboard systems basically pay for themselves through fuel savings alone - I've seen it happen. Real-time tracking shows you which drivers are burning through gas or being rough on the vehicles. You can catch maintenance stuff before it turns into those nightmare $3K repair bills. Route optimization is huge too, cuts out so much wasted driving time. Plus you'll actually know if trucks are sitting idle when they should be working. Honestly, focus on fuel costs and preventing breakdowns first - that's where you'll see money come back fastest. The data makes everything way more obvious than you'd expect.
So for fleet dashboards, I'd go with real-time vehicle maps and fuel trend charts first. Heat maps are honestly where it's at though - you can spot route problems or inefficient areas instantly. KPI gauges work well for MPG averages and driver safety scores. Bar charts comparing different vehicles or drivers tell the story fast. Oh, and definitely include maintenance calendars so nothing falls through the cracks. Skip cramming everything into dense tables - nobody wants to dig through rows of numbers. Your stakeholders should get the fleet's overall health within like 30 seconds of glancing at it.
Set up alerts for the big stuff - breakdowns, maintenance deadlines, route problems. SMS, email, whatever works for your team. But seriously, don't go crazy with notifications or everyone will just ignore them. I learned that the hard way! Different people should get different alerts though. Like, your mechanics need the maintenance stuff, dispatchers handle routing issues. Most systems let you adjust the sensitivity settings too. Honestly? Just pick your top 3 headaches first and build alerts around those. You can always add more later once you've got the basics working.
So most people go with Tableau or Power BI for the heavy analytics stuff. But honestly? Fleet-specific platforms like Samsara and Geotab are way more popular since they do everything - data collection plus dashboards in one shot. Way less headache than building something custom. Some teams use Grafana or build their own with JavaScript frameworks, but that's if you've got the tech skills and time. Oh, and definitely check if your current fleet system already has decent dashboards before dropping money on new tools. Might save you a bunch of hassle.
Dude, get that dashboard set up ASAP. It'll track driver hours automatically so you don't violate DOT regs, plus sends alerts before inspections expire. No more spreadsheet hell - trust me on this one. The maintenance logging happens in the background, which is clutch. Best part? Those license renewal notifications will save your butt when audit time rolls around. I literally used to panic-search for paperwork at 11pm before deadlines. Now everything's just... there. Real-time tracking catches violations before they actually happen too.
Ugh, the data integration is gonna be your worst nightmare - connecting GPS, fuel cards, maintenance stuff into something that actually makes sense. Plus drivers will think you're Big Brother watching them. Start with like 5 vehicles max for a pilot run, that's what I'd do anyway. Training is huge so people don't freak out about being monitored. The upfront costs are brutal but you need quick wins to justify spending all that money. Oh and whatever platform you pick, make sure it doesn't fight with your current systems or you'll be debugging forever.
So this maintenance tracking thing is pretty sweet - you get real-time updates on when your vehicles need service. Way better than scrambling when something breaks down unexpectedly. I'd check those reports weekly if I were you. The system tracks repair histories and shows you patterns, which honestly helps you spot problems before they get expensive. You can actually budget for this stuff instead of getting hit with surprise costs. Plus the predictive alerts are clutch for avoiding breakdowns. Oh, and it makes those keep-vs-replace decisions way easier when you have all the data right there.
Pick the KPIs that actually matter to your business first - fuel costs, delivery times, whatever keeps your boss up at night. Most dashboards let you drag widgets around pretty easily. Set up alerts for maintenance stuff and driver issues so you don't miss the important things. Different people need different views too - dispatchers care about different metrics than executives do. Start basic though, don't try to show everything at once (learned that the hard way). You can always add more later once everyone gets used to it.
So these dashboards basically let you see everything your drivers are doing in real-time - speeding, slamming brakes, all that stuff. You can set alerts for when someone's driving like a maniac. Honestly, it sounds Big Brother-ish but drivers actually start behaving better when they know someone's watching. The data shows you who needs more training and who your rock stars are. We've seen accident rates drop pretty quickly once you implement this. Oh, and definitely start with your worst drivers first - way more bang for your buck that way.
Honestly, digging into your historical data is a game-changer. You'll spot patterns that would never jump out at you otherwise - like which trucks are constantly breaking down or when fuel costs spike seasonally. The dashboard thing is pretty sweet for comparing year-over-year stuff. I'd focus on your biggest three cost drivers first, that's where you'll see real results. Once you know what's draining your budget, you can actually plan maintenance better and negotiate with suppliers using real numbers instead of just guessing. Some routes are total money pits too - the data shows you which ones.
-
SlideTeam was so customer-centric and quick service-provider that I doubted the amount I was paying and literally re-checked the transaction.
-
I am a big fan of their newsletters because that is how I found my perfect requirement at the time of urgency. Thank God, I kept opening those.