

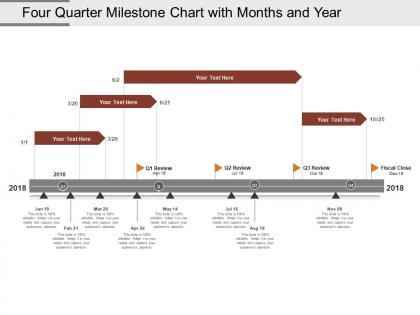
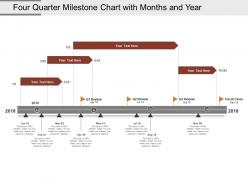
Four quarter milestone chart with months and year




Try Before you Buy Download Free Sample Product
 Impress Your
 Audience
 100%
100% Editable
 Save Hours
 of Time


Get back to being at your best with our Four Quarter Milestone Chart With Months And Year. Feel that drive begin to build anew.
People who downloaded this PowerPoint presentation also viewed the following :
Four quarter milestone chart with months and year with all 5 slides:
Discuss emotive issues with our Four Quarter Milestone Chart With Months And Year. They help your thoughts spread calm.
FAQs for Four quarter milestone chart with
Key components of an effective milestone chart include clear milestone definitions, realistic timelines, specific deliverables, responsible team members, and progress indicators. These elements work together by providing visual project clarity, enabling better resource allocation, and facilitating stakeholder communication, with many organizations finding that well-structured milestone charts significantly enhance project tracking and ultimately deliver improved completion rates.
Milestone charts enhance project management practices by providing clear visual timelines, identifying critical dependencies, tracking progress against key deliverables, and facilitating stakeholder communication throughout project lifecycles. These strategic tools enable project managers to anticipate bottlenecks, allocate resources more effectively, and maintain team alignment, with many organizations finding that milestone visualization significantly improves project completion rates and client satisfaction.
Common pitfalls when creating milestone charts include setting unrealistic deadlines, defining vague milestones, overloading the chart with too many details, and failing to account for dependencies between tasks. These issues can derail project timelines by creating confusion, missed deadlines, and resource conflicts, with many project managers finding that clear, achievable milestones ultimately enhance team coordination and delivery success.
Milestone charts focus exclusively on key project deliverables and deadlines without showing task durations or dependencies, while Gantt charts display detailed timelines, task relationships, and progress bars. Milestone charts provide high-level overviews for executives and stakeholders seeking quick project status updates, whereas Gantt charts enable project managers to track daily operations, resource allocation, and task sequences, ultimately delivering comprehensive project control versus strategic visibility.
**INPUT**: What software tools are best recommended for creating milestone charts? **OUTPUT**: Recommended milestone chart software includes Microsoft Project, Smartsheet, Asana, Gantt Project, and Lucidchart, each offering unique project visualization capabilities. These tools streamline project planning by enabling timeline tracking, resource allocation, and collaborative updates, with many organizations finding that cloud-based platforms like Monday.com and Trello deliver enhanced accessibility and real-time progress monitoring for distributed teams.
Milestone charts can be effectively integrated into Agile project management by tracking sprint completions, release deliverables, major feature launches, and stakeholder review points. While Agile emphasizes iterative development, many organizations find that milestone visualization enhances transparency with stakeholders, streamlines progress communication across teams, and ultimately delivers better alignment between development cycles and business objectives.
Visual best practices for milestone chart design include clear timeline structure, consistent color coding, readable fonts, strategic white space utilization, and intuitive milestone markers like diamonds or circles. These design elements enhance comprehension by minimizing visual clutter, establishing clear progress indicators, and enabling quick status assessment, with many project teams finding that well-designed charts significantly improve stakeholder communication and decision-making efficiency.
Incorporating stakeholder feedback into milestone charts involves regular review sessions, feedback collection mechanisms, and flexible milestone adjustments based on input received. Through collaborative planning tools and scheduled checkpoint meetings, project managers can gather stakeholder insights, reassess timeline feasibility, and modify deliverable dates accordingly, ultimately ensuring alignment between project expectations and stakeholder requirements while maintaining realistic project momentum.
Color coding in milestone charts enhances visual communication by categorizing milestones based on status, priority, department, or timeline phases, making complex project information instantly digestible. Through strategic color schemes, project managers streamline stakeholder communication, accelerate decision-making, and minimize confusion across teams, with many organizations finding that consistent color standards ultimately deliver improved project transparency and faster milestone tracking.
Milestone charts should be updated weekly or bi-weekly during active project phases, with more frequent updates during critical periods or when significant changes occur. This regular cadence enables project managers to track progress accurately, identify potential delays early, and communicate status effectively to stakeholders, ultimately delivering better project outcomes and maintaining team alignment throughout the project lifecycle.
Milestone charts enhance team accountability by clearly defining deliverable deadlines, progress expectations, and individual responsibilities, while providing transparent visibility into project status for all stakeholders. These visual tools enable teams to track performance against commitments, identify potential delays early, and maintain open communication about progress, with many organizations finding that milestone transparency significantly reduces project risks and improves collaborative decision-making.
Milestone charts help in risk management by identifying critical project phases, establishing early warning systems for potential delays, and creating checkpoints for resource reallocation. Through regular milestone reviews, project managers can detect emerging risks, implement corrective measures before issues escalate, and maintain stakeholder confidence, ultimately delivering more predictable outcomes and reduced project failure rates.
Successful projects leveraging milestone charts include software development launches, construction of major infrastructure, pharmaceutical drug trials, aerospace missions, and corporate restructuring initiatives. These projects demonstrate how milestone tracking enables early risk identification, resource reallocation, and stakeholder alignment, with organizations finding that visual progress monitoring ultimately delivers faster project completion and enhanced team accountability.
Cultural differences influence milestone chart design through varying communication styles, time orientations, hierarchy preferences, and decision-making approaches across global teams. While Western cultures often favor detailed linear timelines and individual accountability, many Asian and Latin cultures emphasize collective responsibility and flexible scheduling, with organizations finding that culturally adaptive milestone frameworks enhance team collaboration, reduce misunderstandings, and ultimately deliver more successful project outcomes.
Digital milestone charts offer enhanced collaboration, real-time updates, automated notifications, cloud accessibility, and seamless integration with project management tools. These technologies streamline project tracking by enabling instant modifications, facilitating remote team coordination, and providing comprehensive data analytics, with many organizations finding that digital solutions significantly reduce administrative overhead while delivering faster decision-making and improved project visibility.
-
Best way of representation of the topic.
-
Much better than the original! Thanks for the quick turnaround.