

Git repository powerpoint diagram powerpoint presentation slides





Try Before you Buy Download Free Sample Product
 Impress Your
Audience
 100%
Editable
 Save Hours
of Time


Introducing Git Repository Powerpoint Diagram PowerPoint Presentation Slides This distributed version control system PPT slideshow is ideal to effectively elucidate GIT version control software through the visual aid of industry-best diagrams. Employ our visually-appealing PowerPoint presentation to acquaint your audience with the version management system. Elaborate on the need for GIT by your organization. Elucidate the advantages of the GIT distributed version control application using our version control software PowerPoint layout. You can also convey the features of this distributed revision control tool. Data visualizations featured in this PPT template deck facilitate a better explanation of the GIT architecture. Compile the common commands used in GIT with appreciable ease. Take the advantage of this visually attention-grabbing PPT slide deck and present vital information about the revision control system such as working with remote repositories. This is a must-have virtual solution, especially for upper and mid-level management. So, hit the download icon now and instantly start building an impressive system software presentation.
People who downloaded this PowerPoint presentation also viewed the following :
Content of this Powerpoint Presentation
Slide 1: This slide introduces Git Repository PowerPoint Diagram. Mention your Company name.
Slide 2: This slide gives brief about GIT.
Slide 3: The slide highlights brief introduction about version control system and how it works
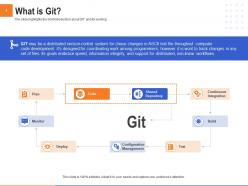
Slide 4: The slide highlights the brief introduction about GIT and its working
Slide 5: The slide shows the importance of GIT for your organization
Slide 6: The slide shows the key advantages of GIT
Slide 7: The slide shows the architecture functionality flow of GIT
Slide 8: The slide highlights the key features of GIT
Slide 9: The slide highlights the most used commands in GIT
Slide 10: The slide shows the working of remote repositories
Slide 11: This is Git Repository PowerPoint Diagram Icons Slide
Slide 12: This slide is titled as Additional Slides for moving forward.
Slide 13: This slide displays Mission, Vision and Goals.
Slide 14: This is Our team slide with Names and Designations.
Slide 15: This slide is titled as Post it Notes. Post your important notes.
Slide 16: This slide displays Roadmap process.
Slide 17: This slide depicts Column Chart for comparison of products.
Slide 18: This slide shows Bar Chart for comparison of products.
Slide 19: This is about us slide to showcase Company specifications.
Slide 20: This slide represents Magnifying Glass for highlighting important content.
Slide 21: This slide shows 30 60 90 Days Plan.
Slide 22: This is Thank you slide with Contact details.
Git repository powerpoint diagram powerpoint presentation slides with all 22 slides:
Use our Git Repository Powerpoint Diagram Powerpoint Presentation Slides to effectively help you save your valuable time. They are readymade to fit into any presentation structure.




FAQs for Git repository powerpoint diagram
So Git repository diagrams are basically like family trees for your code - they show how branches split off, merge back together, and where all your commits live. Super helpful when you're trying to figure out wtf happened in a messy project or explain your workflow to someone else. You can make a quick one by typing `git log --graph` in terminal (it's kinda ugly but works). GitKraken makes prettier ones if you're into that. Honestly, once you start using them, you'll wonder how you ever managed without seeing the visual flow of everything.
Honestly, those diagrams are game-changers for team projects. You get this clear picture of how all your branches connect and where people merged stuff. Way better than scrolling through tons of commit messages trying to figure out what happened last month. They help avoid those annoying merge conflicts too. New people on your team will actually understand the project flow instead of being totally lost. Even just sketching one out helps - I learned this the hard way on my last project. Takes like 10 minutes but saves you hours of headaches later.
For your Git diagram, start with the big three: working directory, staging area, and local repo. Don't forget the remote (GitHub/whatever you're using). I still mess up the staging area sometimes tbh - it's weirdly easy to forget it exists. Show all the commands too: add, commit, push, pull, fetch. Branches are crucial - definitely include main and a feature branch or two. The arrows between everything matter way more than you'd think. Keep it simple at first, then you can throw in the messy stuff like merge conflicts later if you want.
So branches in Git diagrams basically show up as lines splitting off from your main timeline. Pretty much like parallel universes where you can mess around with different features without breaking your main code. Each one tracks its own commits, which is honestly way easier to follow than trying to decode commit messages (those are usually garbage anyway). You'll see your main branch as this straight line with feature branches shooting off and coming back together. The whole visual thing makes the project flow super obvious. When you're lost in your project history - which happens to everyone - just look at the diagram first.
So basically your local repo is just on your computer, but the remote one (like on GitHub) sits on a server everyone can hit. When you `git push`, you're sending your stuff up to the remote. `git pull` grabs changes back down to your machine. Think of it like - you've got your personal draft, then there's the shared version everyone works off. Remote repos are honestly lifesavers for collaboration and backing up your work. Just don't be that person who forgets to push for weeks, then acts surprised when teammates can't see what you've done!
Dude, commit history visualization is a game changer. Instead of scrolling through boring text logs, you get this clear picture of how your project actually grew. Branches become obvious. You can see when features got built and where things probably broke. Honestly, the timeline aspect is what sold me on it - parallel work streams suddenly make sense. Try `git log --graph --oneline` first, though GUI tools are pretty sweet too. You'll catch collaboration bottlenecks and development patterns that were totally invisible before. It's like switching from reading sheet music to actually watching the orchestra play.
Honestly, GitKraken's probably your best bet - their visual branching is actually pretty slick and makes Git look way less intimidating than it usually is. Sourcetree's solid too if you want something different. I mean, you could always just use `git log --graph --oneline` from command line, works better than you'd think for quick stuff. For web viewing there's Gitiles, or if you need something fancy for presentations, Draw.io works. I'd just grab GitKraken's free version first though. The diagrams are clean and your teammates won't give you blank stares when you show them.
Dude, Git repo diagrams are seriously clutch for onboarding. When someone new joins, you just show them the visual instead of explaining your entire workflow verbally. They'll instantly see how branches connect, where features get built, and which one's your main branch. Way better than making them read through docs, honestly. I swear it cuts onboarding time in half - especially when you've got like six feature branches running at once (which happens more than I'd like to admit). The diagram just makes everything click. Start there next time before jumping into actual code.
Don't try cramming every commit and branch into one diagram - it'll look like chaos and confuse everyone. Seriously, I've seen so many that just hurt your eyes. Focus on the main storyline instead. Arrow direction trips people up constantly - they go from parent to child commits, not the other way around. Also, skip generic branch names like "feature1" when you're making examples. Pick something that actually makes sense. Keep your colors consistent across branches or people won't be able to follow anything. Start simple first, then add complexity only if you really need it. Most of the time you don't.
So Git diagrams basically map out your whole branch situation visually. The main branch runs horizontal, then you see feature branches splitting off and merging back. Each commit shows up as a dot connected by lines - way easier than keeping track mentally, trust me. You can actually spot potential merge conflicts early this way, plus see how everyone's changes fit together. Oh, and if you want a quick one in terminal, try `git log --graph --oneline`. Super handy for getting the big picture without opening another tool.
Dude, Git diagrams are seriously underrated. They show you exactly where branches split off and which commits are gonna clash before you dive into merging. You can spot the files that got changed on different branches and know what you're walking into. The timeline thing is clutch too - you can trace back through commits and actually understand why someone made those changes in the first place. Makes conflict resolution feel way less random, you know? Trust me, next time you're staring down a nightmare merge, check the diagram first. Way better than just winging it.
So tags are like permanent bookmarks that stick to specific commits - you'll see them as little arrows or boxes in Git diagrams. They mark big stuff like releases (v1.0, v2.1) or major milestones. Unlike branches that keep moving, tags don't budge once you place them. Super useful for finding stable versions quickly. Honestly, they're way better than trying to remember random commit hashes when you need to reference something important later. Just look for the tagged commits in your diagram - those are usually your safe deployment points or release candidates.
Dude, color coding is a total game changer for Git diagrams. Your brain just picks up the visual patterns way faster than reading through labels. I usually start with different colors for each branch - makes it super obvious which commits belong where. Then maybe add colors for different commit types once everyone gets used to it. Honestly, tracking feature branches vs hotfixes becomes so much easier when you can just glance and see the colors. Plus you'll spot merge conflicts and weird unmerged stuff right away. I mean, I guess you could work without it, but why make life harder?
For pull requests in Git diagrams, I usually draw dotted arrows from the feature branch pointing to main (or whatever your target is). Adding a little PR icon next to it helps - honestly makes a huge difference for clarity. Different colors work great too: green for merged PRs, yellow for open ones, red if they got rejected. Short sentences rock here. You can throw in reviewer names or PR numbers if you're feeling extra, but the main thing is making it look different from regular commits. That way people don't have to guess what they're looking at, you know?
Your Git diagram basically becomes the team's GPS for navigating all the branches and merges. Without it being current, new people get totally lost trying to figure out the workflow. Plus you'll waste so much time in code reviews when nobody knows which branch connects where. Complex merge strategies are inevitable - and that's when an outdated diagram really screws everyone over. I'd suggest updating it during sprint retros since it literally takes like 5 minutes. Way better than spending hours later untangling confusion about how features actually move from dev to production.
-
The Designed Graphic are very professional and classic.
-
Excellent work done on template design and graphics.
-
Innovative and Colorful designs.
-
Awesome use of colors and designs in product templates.