


Headcount Dashboard Powerpoint Ppt Template Bundles




Try Before you Buy Download Free Sample Product
 Impress Your
 Audience
 100%
100% Editable
 Save Hours
 of Time


Our Headcount Dashboard Powerpoint Ppt Template Bundles are topically designed to provide an attractive backdrop to any subject. Use them to look like a presentation pro.
People who downloaded this PowerPoint presentation also viewed the following :
Headcount Dashboard Powerpoint Ppt Template Bundles with all 17 slides:
Use our Headcount Dashboard Powerpoint Ppt Template Bundles to effectively help you save your valuable time. They are readymade to fit into any presentation structure.
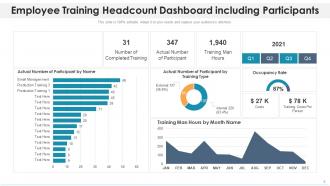
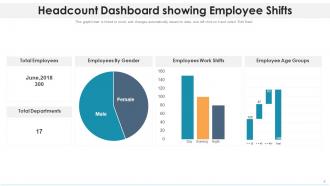
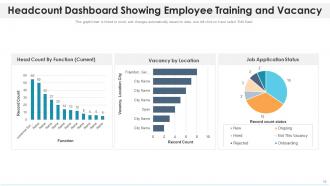
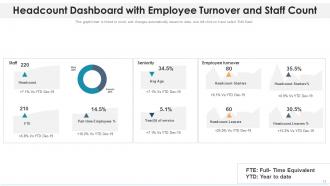





FAQs for Headcount Dashboard Powerpoint
Start with headcount broken down by department, location, and employment type - the usual full-time vs contract stuff. Age ranges and tenure are super useful too, plus diversity metrics if your company's tracking those. Honestly though? Turnover rates and new hire counts are where the real story is - way more telling than just static numbers. Oh, and make sure you can filter by different time periods because trends beat snapshots every time. Leadership always wants to see patterns anyway. Once you nail these basics, you can add whatever specific metrics they're obsessing over this quarter.
Honestly, line charts are your best bet here - show those headcount changes month by month or quarterly. Break everything down by department or location so you can actually see what's happening. Bar charts work too if you're comparing specific periods. Here's the thing though - don't try to cram everything into one view because people will just get overwhelmed and stop looking at it altogether. Keep it clean and simple. Add some filters so your stakeholders can dig into whatever they actually want to see. I'd probably start with your biggest departments first, then build out the rest once you get some feedback.
Honestly, think of it as your go-to spot for all workforce stuff. Shows you real-time staffing levels, who's leaving, where you're short on people - basically everything you need to not panic about resources. Way better than digging through Excel hell every month (seriously, never going back to that). You'll catch problems early, like when accounting is drowning or you're about to blow your hiring budget. Plus leadership actually listens when you have solid data backing up your "we need more people" requests. Just figure out which numbers actually matter for your planning first - don't try tracking everything at once.
Honestly, real-time data changes everything. Your dashboard goes from being this backward-looking report to something you can actually use to make decisions. You'll spot staffing problems or budget issues right when they happen - no more waiting around for HR to send you a report three weeks later. Quick pivots become possible. Pause hiring here, speed up interviews there. I know a manager who caught a massive contractor bill before it got out of hand, just because he had live numbers. The trick is setting up alerts for whatever matters most to your specific situation.
Build separate dashboards for each team - HR gets their turnover stuff, finance sees cost breakdowns, etc. Make filters super intuitive so managers don't get overwhelmed by company-wide numbers when they just want their team's data. Pro tip: actually ask each department what they check daily instead of guessing what metrics matter to them. Clean interface is key - don't shove everything on one page. Oh, and set up alerts for weird spikes in the data. Your department heads will thank you if they can easily export their views for their own reports too.
So basically you'd want to break down your employee data by gender, ethnicity, age - all that stuff. Track hiring and promotion rates across different groups, plus pay gaps (that's where things get real interesting honestly). Visual charts beat the hell out of spreadsheets for spotting which teams need work. Don't forget retention rates by demographic too - hiring people is one thing, but keeping them around shows if they actually feel welcome. Oh, and set alerts when your diversity numbers dip below targets. Way easier to fix problems before they get worse.
Honestly, Power BI is probably your safest bet, especially if you're already using Microsoft stuff - it just connects so easily with Excel. Tableau's solid too but kinda feels like bringing a rocket launcher to a water balloon fight unless you're doing crazy complex analysis. Looker's another good option. Oh, and Google Data Studio works fine for basic headcount stuff if you want something simple. I'd say figure out exactly what metrics you need first though. Then just pick whatever fits your budget and how techy you want to get with it.
Honestly, skip the manual uploads - that's where everything goes wrong. Set up automated feeds from your HRIS instead. You need someone owning data governance rules (like who inputs what) and regular audits to catch weird stuff early. I've watched so many dashboards turn into fancy spreadsheets with ancient data, it's painful. Get your employee status definitions consistent across departments first - everyone needs the same categories. Build in validation checks for random spikes in headcount or whatever. Oh, and work backwards from your most critical data sources. Way easier than trying to fix everything at once.
So for headcount dashboards, start simple - a basic line chart tracking month-over-month growth answers like 80% of what people actually want to know. Bar charts are perfect for comparing departments. Line charts obviously work great for trends over time. For team breakdowns, donut charts look way cleaner than regular pie charts (if your tool has them). Stacked bars are clutch when you need to show total headcount plus role/seniority breakdowns at the same time. Oh and heat maps work really well for visualizing headcount across different offices or business units. Though honestly, I'd stick with the basics first - you can always get fancy later once you know what questions keep coming up.
Check out growth rates and turnover trends in your headcount dashboard - that's where the real patterns hide. Maybe you always hire 20% more engineers after New Year's, or sales reps bail after bonus season (tale as old as time). Look at each department separately and see how headcount shifts line up with revenue goals or big company moves. Project those trends forward based on what's coming up. Honestly, I'd run three scenarios - conservative, aggressive, and middle ground. That way you won't get blindsided when budget planning rolls around.
Don't cram everything onto one screen - people just tune out when there's too much. Vanity metrics are the worst honestly, they look cool but tell you nothing useful. I've seen so many dashboards that are basically just eye candy with zero direction. Keep your data fresh too because showing someone as "active employee" when they quit 3 weeks ago? Yeah, that's embarrassing. Focus on what actually matters to whoever's looking at it. Give them something they can act on, not just pretty numbers to stare at.
Look, having a headcount dashboard basically saves your butt during compliance stuff. You can see all your workforce data in real-time - overtime hours, break schedules, staffing levels, the works. Audits become way less stressful because everything's already tracked automatically instead of you digging through a million spreadsheets (been there, not fun). The system will ping you when temp workers are getting close to permanent status or when you're hitting benefit thresholds. I'd definitely set up those automated reports for your legal team. They'll catch problems early before they turn into expensive headaches. Trust me, it's worth the setup time.
Looking at headcount changes across different teams tells you a lot. Growing units obviously hire more people consistently. Declining ones freeze hiring or make cuts. The really interesting stuff is when you see wild swings - that usually means terrible workforce planning or they're stuck dealing with project cycles that are all over the place. Honestly, anything above 15% variance quarter-to-quarter is worth digging into. Those big swings typically mean there's some operational mess going on underneath that someone needs to fix.
Honestly, just ask your users what they actually need - they'll tell you which metrics matter and what's driving them crazy about the layout. I've watched so many gorgeous dashboards sit there unused because nobody bothered checking if they were helpful. Monthly feedback sessions work great, or even a quick survey. People will flag data issues you'd never catch, plus they'll ask for stuff like better filters or export options. Different teams use the same data totally differently too, so you'll learn things that surprise you. Makes such a difference in whether people actually open the thing.
Start with API connectivity - your dashboard needs to pull live data from HRIS, payroll, and ATS automatically. Nobody wants another login, so single sign-on is a must. Data mapping between systems can be a nightmare though. Employee IDs, department codes, job titles - they all have to sync up perfectly or your numbers will be garbage. Set up automated refresh schedules too. Oh, and plan for when systems inevitably crash. First step? Map out what data you've got and where it currently lives in your HR stack.
-
Great designs, Easily Editable.
-
Really like the color and design of the presentation.