


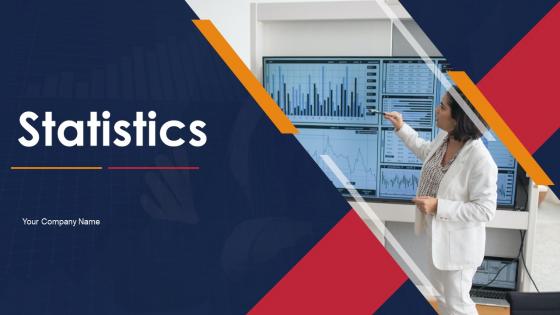
Statistics powerpoint ppt template bundles




Try Before you Buy Download Free Sample Product
 Impress Your
 Audience
 100%
100% Editable
 Save Hours
 of Time


Our Statistics Powerpoint Ppt Template Bundles are topically designed to provide an attractive backdrop to any subject. Use them to look like a presentation pro.
People who downloaded this PowerPoint presentation also viewed the following :
Statistics powerpoint ppt template bundles with all 17 slides:
Use our Statistics Powerpoint Ppt Template Bundles to effectively help you save your valuable time. They are readymade to fit into any presentation structure.








FAQs for Statistics powerpoint
Honestly, I'd grab a few templates and test them with your actual data first - saves so much headache later. Find ones with chart placeholders already built in and decent white space around them. Your data needs room to breathe, you know? Skip anything with crazy fonts or busy backgrounds that'll fight with your graphs. The good templates usually have different layouts for bar charts, pie charts, all that stuff. Color schemes matter too - you want something clean that won't clash. Nothing's worse than cramming a complex dataset into some cluttered mess of a slide.
Honestly, stats templates are lifesavers because they handle all the design work you don't want to do. You get clean layouts and colors that actually make sense together instead of creating some frankenstein chart yourself. Most people aren't designers anyway – I know I'm not! The template guides people through your data story without them getting lost in ugly formatting. Just pick one that fits your vibe and complexity level. Your audience won't have to squint at messy graphs, which is half the battle when presenting numbers.
Bar charts are your best friend for comparisons - I use them way too much honestly. Line graphs show trends over time nicely. Pie charts work when you're breaking down parts of a whole, though some people hate them lol. Scatter plots are perfect for showing relationships between two things. Histograms display how your data's distributed. Box plots are awesome for quartiles and spotting outliers. Heat maps make messy datasets actually readable. Just pick whatever tells your story clearest, not the flashiest option.
Oh totally, colors can make or break your data story. Like if you use red for good stuff, people automatically think something's going wrong - our brains are just wired that way. Green = good, red = bad, blue for neutral stuff. I've sat through so many presentations where they used colors that were basically identical. Nightmare. You want high contrast so people can actually tell your data apart. Also maybe check how it looks on different screens first? Sometimes what looks great on your laptop looks terrible projected. Trust me on this one - learned it the hard way.
So infographics are basically magic for making your boring stats actually interesting. They turn numbers into visual stories people can actually follow. Use charts and icons to show trends or comparisons - way better than drowning people in spreadsheet data. Executives especially love this stuff since they tune out the second you throw too many numbers at them. Pick the right type though - timelines work great for showing changes over time, bar charts for rankings, that kind of thing. Oh and start with your main point first, then find templates that make it pop visually.
Honestly, templates are a game-changer for keeping your presentations looking professional. You won't have your audience getting distracted by wonky formatting when they should be focusing on your data. Same fonts, colors, chart styles - the whole nine yards. I used to waste so much time picking colors every single time! Now I just have my go-to template and tweak it slightly depending on what I'm presenting. Way faster. Get your team using the same one too, or you'll end up with presentations that look like they're from totally different companies. Trust me on this one.
Honestly, clean visuals are everything. Don't go crazy with fonts - stick to 2-3 max and keep colors consistent throughout. Those 3D pie charts might look fancy but they're awful to read (learned that the hard way). Make your text big enough so people in the back can actually see it. Short sentences work better than cramming everything together. You'll want clear labels on axes and legends too. Oh, and definitely test your slides on different screens beforehand - I've had presentations look completely different on the projector. Focus on the key insights rather than drowning people in every data point you collected.
Yeah, animations can definitely help with stats presentations! I'd use them to reveal data bit by bit - prevents people from getting hit with a crazy complex chart right away. Fade-ins work great for new data series, and you can do subtle highlighting for the important numbers. Just... please avoid those bouncy spinning effects that look super dated. Nobody needs that chaos when they're trying to follow your numbers. The goal is keeping it clean so people actually track your story instead of getting distracted by flashy nonsense. Progressive reveals are honestly a game-changer for complex data.
Ugh, the worst thing you can do is cram everything onto one slide - people just zone out completely. Tiny fonts are death too, especially if someone's sitting in the back. I've sat through way too many presentations where I'm squinting at unreadable charts! Skip those crazy animated templates that make your data look like a disco ball. Simple colors work better anyway. Oh, and definitely check how your slides look on the actual screen beforehand - what looks fine on your laptop might be a nightmare projected on the wall. Trust me on that one.
Go with something super clean - minimal designs work best because your data needs to breathe. Dashboard templates are perfect for this stuff, they're literally made for charts and graphs. Trust me, I've sat through way too many presentations where some fancy gradient background made everything unreadable. Blues and grays are your friends here. White backgrounds too. The whole point is making your numbers the main event, not fighting with some decorative mess. Oh, and loads of whitespace - cramped layouts kill even the best data stories.
Know your crowd first - that's everything. Academic types want all the messy details: methodology breakdowns, data tables, proper citations. They eat that stuff up. Business people? Complete opposite. Hit them with executive summaries right away and clean visuals that get to the point fast. Skip the statistical mumbo jumbo for corporate talks. Focus on ROI instead. Academics don't mind text-heavy slides, but business folks will zone out if there's too much reading. Honestly, I learned this the hard way once. Ask yourself: do they care about the process or just the bottom line?
Dude, you gotta turn your data into an actual story if you want people to care. Nobody remembers random charts from meetings, but they'll totally remember when your Q3 numbers showed that crazy comeback story. Structure it like any good story - here's the problem, here's what the data shows, boom here's what we do about it. I mean, our brains are literally wired for narratives, not spreadsheets. Set up your slides so there's a clear beginning, middle, and end. Trust me, people will actually listen instead of just waiting for the meeting to end.
So basically these templates can hook straight into your data sources - Excel files, databases, whatever you're using. Your charts update automatically when the numbers change. No more copy-pasting every single time, which honestly used to drive me crazy. The tricky part is nailing that initial setup though. You really want to get those connections right from the beginning or you'll be troubleshooting later. But once it's working? Total lifesaver. Your presentations stay fresh without you having to think about it.
Microsoft's template gallery is decent but kinda basic. Check out SlideModel or PresentationGo for better chart designs - though heads up, some free ones look super outdated. GraphicRiver has really clean modern templates if you don't mind paying a bit. Canva's PowerPoint templates have gotten way better lately too, which surprised me. Oh, and 24Slides has some solid infographic-style ones. Honestly? Download a few different styles and tweak the colors to match your brand. You'll definitely end up reusing them anyway.
Okay so for in-person stuff, go way bigger on fonts - like 24pt minimum because people are sitting far back. With webinars though? That's where it gets annoying. Everyone's on tiny laptops or getting distracted by Slack notifications. I'd bump text even larger and use really high contrast colors. Seriously, fewer data points per slide too - screen sharing makes everything look like garbage. Oh and pause way more during webinars since people can't just lean in to squint at details like they would in a real room. Test your slides by actually viewing them through Zoom first because what looks perfect on your monitor turns into a blurry mess once it's compressed.
-
Editable templates with innovative design and color combination.
-
Attractive design and informative presentation.
-
Excellent products for quick understanding.
-
Design layout is very impressive.