

Heatmap showing probability and risk from low to high 3 x 3 powerpoint ideas




Try Before you Buy Download Free Sample Product
 Impress Your
Audience
 100%
Editable
 Save Hours
of Time


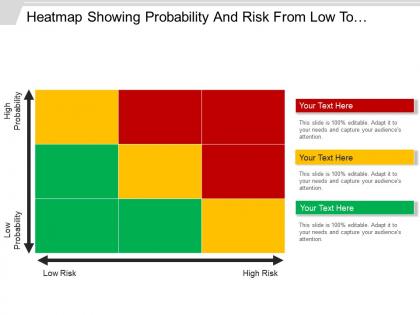
Visually represent the results of your risk assessment process with our risk heatmap PPT slide template. It allows you to easily establish as well as communicate the holistic view of your business risks which may affect your company operations. You can use this risk matrix PPT design to graphically describe the possibility of risk occurrence and its impact on business. Thus, your management can take some strategic decisions on the basis of risk probability towards the health of your enterprise in the long run. This ERM PPT model also helps in identifying the risks which needs immediate management attention through this low to high level of risks. Because it allows the management to focus on the high risk factors. You can also explain the various internal or external risk factors which may affect your business framework with this risk analysis PPT layout. Therefore, start working on this risk assessment chart PowerPoint layout for initializing the process. Attract the big boys with our Heatmap Showing Probability And Risk From Low To High 3 X 3 Powerpoint Ideas. Display the class they always expect.
People who downloaded this PowerPoint presentation also viewed the following :
Content of this Powerpoint Presentation
Description:
The image depicts a PowerPoint slide with a heatmap titled "Heatmap Showing Probability And Risk From Low To High." The heatmap is a 3x3 grid with color coding representing varying levels of risk (from low to high) against the likelihood of occurrence (from low probability to high probability). The horizontal axis shows the risk level increasing from left to right, and the vertical axis shows the probability increasing from bottom to top. The colors range from green (low risk, low probability) to red (high risk, high probability), with yellow as an intermediate level.
Use Cases:
Such a heatmap is useful in various industries for risk assessment and management:
1. Financial Services:
Use: Assessing investment risks and probabilities.
Presenter: Risk Manager
Audience: Investors, Financial Analysts
2. Healthcare:
Use: Mapping the probability and impact of potential health risks.
Presenter: Public Health Official
Audience: Healthcare Providers, Policy Makers
3. Manufacturing:
Use: Evaluating risks associated with the manufacturing process.
Presenter: Operations Manager
Audience: Production Staff, Safety Officers
4. Information Technology:
Use: Identifying cybersecurity threats and their potential impact.
Presenter: IT Security Analyst
Audience: IT Staff, Management
5. Insurance:
Use: Determining insurance premiums based on risk probability.
Presenter: Actuary
Audience: Underwriters, Claims Adjusters
6. Environmental Management:
Use: Gauging environmental hazards and their occurrence rates.
Presenter: Environmental Scientist
Audience: Environmental Agencies, Conservationists
7. Project Management:
Use: Analyzing project risks and their likelihood.
Presenter: Project Manager
Audience: Project Team Members, Stakeholders
Heatmap showing probability and risk from low to high 3 x 3 powerpoint ideas with all 5 slides:
Joy emerges due to our Heatmap Showing Probability And Risk From Low To High 3 X 3 Powerpoint Ideas. Feel the elation build up inside you.


FAQs for Heatmap showing probability and risk from low to high 3 x
Heatmap risk assessment delivers enhanced visual clarity, prioritized resource allocation, improved stakeholder communication, faster decision-making, and streamlined risk monitoring throughout project lifecycles. These visual tools enable project managers to quickly identify high-impact vulnerabilities, allocate mitigation resources strategically, and maintain comprehensive oversight, with many organizations finding that heatmaps significantly reduce project delays and cost overruns.
Heatmaps enhance risk management decision-making by providing instant visual clarity of threat landscapes, enabling rapid identification of high-priority vulnerabilities, and facilitating resource allocation across multiple risk categories simultaneously. Through color-coded matrices, organizations streamline assessment processes, accelerate response times, and improve stakeholder communication, with many financial institutions and healthcare providers finding that visual risk mapping ultimately delivers faster strategic decisions and enhanced operational efficiency.
Data types most suitable for heatmaps include correlation matrices, time-series performance data, geographical distributions, user behavior patterns, and comparative metrics across multiple variables. These visualizations excel at revealing patterns in financial risk portfolios, website analytics, sales performance by region, and operational KPIs, enabling organizations to quickly identify hotspots, trends, and anomalies for strategic decision-making.
Color gradients in heatmaps significantly influence risk perception by providing intuitive visual cues, with red typically signaling high-priority threats and green indicating lower concerns, while yellow and orange represent moderate risks. This strategic color coding enables stakeholders across organizations, from financial services to healthcare institutions, to quickly identify critical areas requiring immediate attention, streamline decision-making processes, and allocate resources more effectively based on visual risk hierarchies.
Industries with complex operational environments and high-stakes decision-making benefit most from heatmap risk assessments, including healthcare, financial services, manufacturing, energy, and construction. These visual tools enable organizations to streamline risk identification, enhance resource allocation, and accelerate response times, with many finding that clearer risk visualization ultimately delivers improved safety outcomes and competitive operational advantages.
Organizations can effectively integrate heatmap analyses by embedding visual risk matrices into regular governance reviews, aligning color-coded severity scales with existing risk appetites, and connecting heatmap outputs to decision-making workflows. Through automated data feeds and standardized reporting cycles, companies streamline risk identification, enhance board-level communications, and accelerate response times, with many financial services and healthcare institutions finding that integrated heatmaps significantly improve strategic risk oversight.
Common pitfalls include using inconsistent scales, oversimplifying complex risks, neglecting stakeholder input, failing to update regularly, and poor color choices that confuse interpretation. These visualization errors can mislead decision-makers in financial services, healthcare, and manufacturing sectors, ultimately compromising risk management effectiveness and strategic planning, with many organizations finding that standardized frameworks and regular validation significantly enhance accuracy.
Heatmaps enable risk prioritization by visually categorizing threats based on probability and impact levels, allowing portfolio managers to quickly identify high-priority risks requiring immediate attention. Through color-coded matrices, organizations can allocate resources strategically, focus mitigation efforts on critical vulnerabilities, and maintain oversight across multiple projects simultaneously, ultimately delivering enhanced decision-making and optimized risk management efficiency.
**INPUT**: What tools or software are recommended for developing heatmap risk assessments? **OUTPUT**: Recommended tools include GRC platforms like MetricStream and ServiceNow, specialized software such as Riskturn and Sword Active Risk Manager, and versatile options like Tableau, Power BI, and Excel for visualization. These solutions streamline risk identification, automate data collection, and enhance visual reporting, with many organizations finding that integrated platforms deliver comprehensive risk oversight and improved decision-making capabilities. *[Word count: 56 words]*
Dynamic heatmaps evolve throughout project lifecycles by automatically updating risk probabilities, impact assessments, and mitigation statuses as new data emerges from project milestones, stakeholder feedback, and environmental changes. These adaptive visualization tools enable project managers to track risk migration patterns, identify emerging threats in real-time, and adjust resource allocation strategies, with many organizations finding that dynamic monitoring reduces project delays by up to 30% while enhancing strategic decision-making capabilities.
Stakeholder input ensures heatmaps reflect diverse perspectives on risk probability and impact, incorporating frontline insights, departmental expertise, and operational knowledge that leadership might overlook. Through collaborative workshops and structured interviews, organizations gather comprehensive risk intelligence from various levels and functions, ultimately delivering more accurate threat identification and strategic mitigation planning.
Heatmaps support compliance and regulatory assessments by visualizing risk concentrations, identifying control gaps, and tracking regulatory requirements across organizational processes and departments. Through color-coded risk mapping, financial institutions, healthcare organizations, and manufacturing companies can demonstrate compliance posture to auditors, prioritize remediation efforts, and streamline regulatory reporting, ultimately delivering enhanced transparency and proactive risk management.
Heatmap visualizations can be tailored by adjusting detail levels, metrics focus, and presentation formats to match audience needs and decision-making responsibilities. For executives, heatmaps emphasize high-level strategic risks with simplified color coding and summary dashboards, while project teams require granular data with specific risk categories, mitigation timelines, and actionable details, ultimately enabling targeted communication and faster risk response across organizational levels.
Risk heatmaps should include probability of occurrence, potential impact severity, detection likelihood, existing control effectiveness, and regulatory compliance status. These metrics enable organizations across sectors like banking, healthcare, and manufacturing to prioritize resource allocation strategically, streamline risk mitigation efforts, and ultimately deliver enhanced operational resilience while maintaining competitive advantage.
Heatmaps enable real-time risk identification by continuously monitoring data patterns, visualizing anomalies through color-coded alerts, and tracking threshold breaches across multiple risk factors simultaneously. Through dynamic data integration, organizations in financial services, manufacturing, and healthcare can detect emerging threats like fraud patterns, equipment failures, or patient safety issues, ultimately delivering faster response times and enhanced operational resilience.
-
The content is very helpful from business point of view.
-
Awesome use of colors and designs in product templates.