

Diapositivas de presentación de Powerpoint de gestión de operaciones de TI




Try Before you Buy Download Free Sample Product
 Impress Your
Audience
 100%
Editable
 Save Hours
of Time


Nuestras diapositivas de presentación de Powerpoint de gestión de operaciones de TI están diseñadas por temas para proporcionar un telón de fondo atractivo para cualquier tema. Úselos para parecer un profesional de la presentación.
People who downloaded this PowerPoint presentation also viewed the following :
Contenido de esta presentación de Powerpoint
Diapositiva 1 : Esta es la diapositiva de la portada de la presentación de PowerPoint de gestión de operaciones de TI.
Diapositiva 2 : esta es la diapositiva de tabla de contenido que enumera todos los elementos esenciales cubiertos en la plataforma.
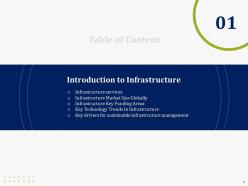
Diapositiva 3 : Esta diapositiva presenta Introducción a la infraestructura.
Diapositiva 4 : Esta diapositiva presenta diferentes categorías de servicios de infraestructura.
Diapositiva 5 : Esta diapositiva presenta el tamaño del mercado de Infraestructura a nivel mundial.
Diapositiva 6 : Esta diapositiva muestra áreas clave de inversión en infraestructura. Puede editar esto según sus requisitos.
Diapositiva 7 : Esta diapositiva presenta tendencias tecnológicas clave en infraestructura.
Diapositiva 8 : Esta diapositiva presenta los impulsores clave para la gestión sostenible de la infraestructura.
Diapositiva 9 : Esta diapositiva presenta el proceso de gestión de activos.
Diapositiva 10 : Este marco describe las responsabilidades de gestión de activos de una organización.
Diapositiva 11 : Esta diapositiva presenta el proceso de administración de activos que puede ayudarlo a alcanzar sus objetivos de inversión.
Diapositiva 12 : Esta diapositiva presenta el ciclo de vida de la gestión de activos (1/1)
Diapositiva 13 : Esta diapositiva presenta el ciclo de vida de la gestión de activos (1/1)
Diapositiva 14 : Esta diapositiva presenta la gestión de activos y condiciones.
Diapositiva 15 : Esta diapositiva presenta una tabla de evaluación de activos que se puede usar para incluir todos sus activos, así como cualquier peligro asociado con ellos.
Diapositiva 16 : Esta diapositiva muestra la evaluación del estado de las instalaciones individuales.
Diapositiva 17 : Esta diapositiva ofrece una idea del modelado del deterioro.
Diapositiva 18 : Esta diapositiva brinda una idea de los tipos de modelos de deterioro.
Diapositiva 19 : Esta diapositiva muestra la condición pasada y futura de sus activos y también las medidas prescriptivas que se deben tomar.
Diapositiva 20 : esta diapositiva presenta la evaluación de riesgos y el modelado de deterioro
Diapositiva 21 : Esta diapositiva ofrece una idea de la optimización y la toma de decisiones.
Diapositiva 22 : Esta diapositiva ofrece una idea de la optimización de la infraestructura
Diapositiva 23 : Esta diapositiva presenta el proceso de decisión de gestión de activos.
Diapositiva 24 : Esta diapositiva presenta la metodología de toma de decisiones impulsada por el valor
Diapositiva 25 : Esta diapositiva ofrece una idea de las funciones de rendimiento y costo.
Diapositiva 26 : Esta diapositiva presenta la gestión del rendimiento de los activos
Diapositiva 27 : Esta diapositiva presenta la pirámide de mantenimiento de la gestión del desempeño
Diapositiva 28 : Esta diapositiva presenta la puntuación y el análisis del rendimiento
Diapositiva 29 : Esta diapositiva presenta la tabla de costos de infraestructura
Diapositiva 30 : Esta diapositiva muestra varios factores que pueden cambiar el costo de su proyecto de infraestructura.
Diapositiva 31 : Esta diapositiva brinda una idea de la interdependencia, la resiliencia y la seguridad.
Diapositiva 32 : Esta diapositiva presenta el Marco de Evaluación de Dependencias e Interdependencias de Infraestructura Crítica.
Diapositiva 33 : Esta diapositiva presenta la rueda de resiliencia de la infraestructura.
Diapositiva 34 : Esta diapositiva presenta los componentes adaptativos del ciclo de vida de un marco de resiliencia.
Diapositiva 35 : Esta diapositiva presenta 4 dimensiones de la seguridad de la infraestructura.
Diapositiva 36 : Esta diapositiva presenta la gestión de contratos y flujos de trabajo.
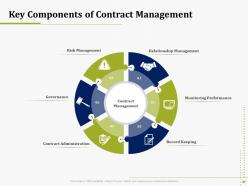
Diapositiva 37 : Esta diapositiva presenta los componentes clave de la gestión de contratos.
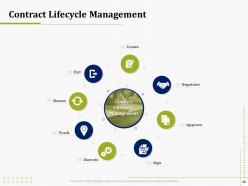
Diapositiva 38 : Esta diapositiva presenta la gestión del ciclo de vida del contrato.
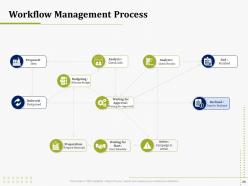
Diapositiva 39 : Esta diapositiva presenta el proceso de gestión del flujo de trabajo.
Diapositiva 40 : Esta diapositiva ofrece una idea de cómo poner en marcha nuevas instalaciones.
Diapositiva 41 : Esta diapositiva muestra varios niveles de puesta en marcha en diferentes fases del proyecto.
Diapositiva 42 : Esta diapositiva presenta diferentes niveles de puesta en servicio.
Diapositiva 43 : Esta diapositiva presenta el presupuesto de capital.
Diapositiva 44 : Esta diapositiva presenta un resumen del gasto de capital.
Diapositiva 45 : Esta diapositiva presenta los detalles de los gastos de capital.
Diapositiva 46 : Esta diapositiva ofrece una idea del Período de recuperación descontado: Resumen de valoración.
Diapositiva 47 : Esta diapositiva ofrece un vistazo del Valor Actual Neto - Resumen de Valuación.
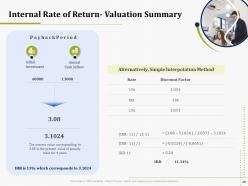
Diapositiva 48 : Esta diapositiva presenta la Tasa Interna de Retorno - Resumen de Valuación.
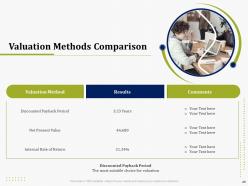
Diapositiva 49 : Esta diapositiva presenta la Comparación de métodos de valoración.
Diapositiva 50 : esta diapositiva presenta las métricas y el tablero de KPI
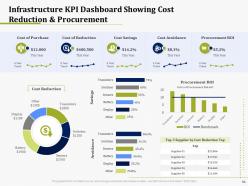
Diapositiva 51 : Esta diapositiva ofrece un vistazo del panel de KPI de infraestructura que muestra la reducción de costos y las adquisiciones.
Diapositiva 52 : Esta diapositiva brinda un vistazo del panel de KPI de infraestructura que muestra la asignación de recursos.
Diapositiva 53 : Esta diapositiva brinda un vistazo del panel de KPI de infraestructura que muestra los ingresos del proyecto.
Diapositiva 54 : Esta diapositiva brinda una idea de las métricas de KPI de infraestructura que muestran el área de metros cuadrados
Diapositiva 55 : Esta diapositiva brinda una idea de las métricas de KPI de infraestructura que muestran ahorros de costos.
Diapositiva 56 : Esta es una diapositiva de icono. Úselo según sus necesidades.
Diapositiva 57 : Esta es una diapositiva adicional
Diapositiva 57 : Esta es una diapositiva adicional
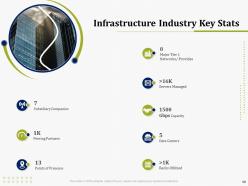
Diapositiva 58 : Esta diapositiva presenta estadísticas clave de la industria de la infraestructura
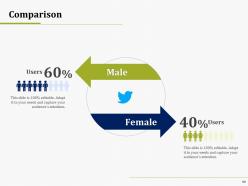
Diapositiva 59 : Esta es una diapositiva de comparación que se puede usar para realizar un análisis comparativo.
Diapositiva 60 : Esta es la diapositiva Nuestra misión que se puede usar para establecer su misión y visión.
Diapositiva 61 : Esta es una diapositiva de imagen de generación de ideas para presentar aspectos innovadores/creativos.
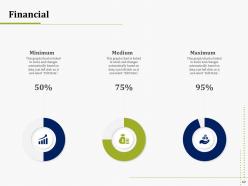
Diapositiva 62 : esta es la diapositiva de puntajes financieros. Indique sus aspectos financieros, etc. aquí.
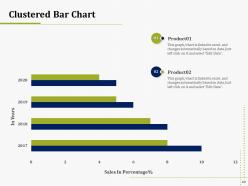
Diapositiva 63 : esta es una diapositiva de gráfico de líneas y columnas agrupadas que se puede usar para comparar diferentes elementos.
Diapositiva 64 : esta es la diapositiva de notas adhesivas que se puede usar para mantener la información importante en un solo lugar.
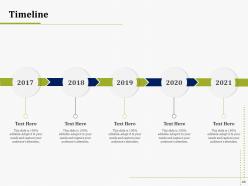
Diapositiva 65 : Esta es una diapositiva de línea de tiempo que se puede usar para presentar una secuencia cronológica de eventos.
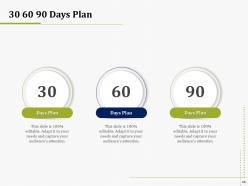
Diapositiva 66 : Esta es la diapositiva del Plan de 30 60 90 días que se puede usar para crear planes sólidos.
Diapositiva 67 : Esta es la diapositiva de agradecimiento por el reconocimiento. Puede compartir sus datos de contacto aquí.
Diapositivas de presentación de Powerpoint de administración de operaciones de TI con las 67 diapositivas:
Utilice nuestras diapositivas de presentación de Powerpoint de administración de operaciones de TI para ayudarlo a ahorrar su valioso tiempo de manera efectiva. Están listos para encajar en cualquier estructura de presentación.
-
IT Operations Management
-
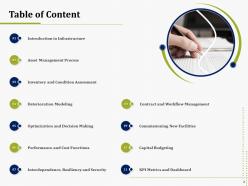
Table of Content
-
Introduction to Infrastructure
-
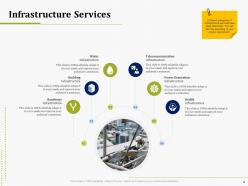
Infrastructure Services
-
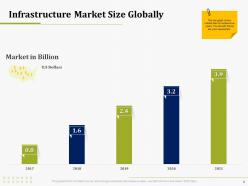
Infrastructure Market Size Globally
-
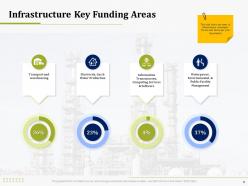
Infrastructure Key Funding Areas
-
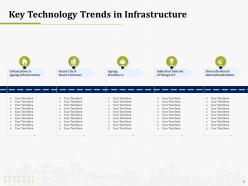
Key Technology Trends in Infrastructure
-
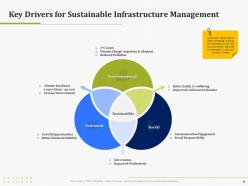
Key Drivers for Sustainable Infrastructure Management
-
Asset Management Process
-
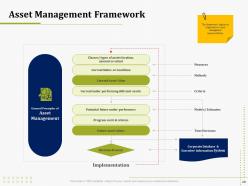
Asset Management Framework
-
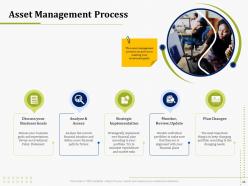
Asset Management Process
-
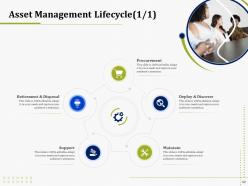
Asset Management Lifecycle 1 1
-
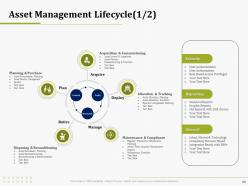
Asset Management Lifecycle 1 2
-
Asset and Condition Assessment
-
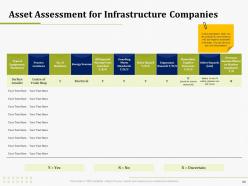
Asset Assessment for Infrastructure Companies
-
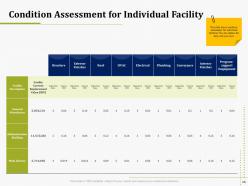
Condition Assessment for Individual Facility
-
Table of Content
-
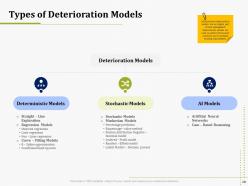
Types of Deterioration Models
-
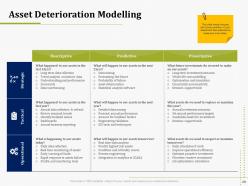
Asset Deterioration Modelling
-
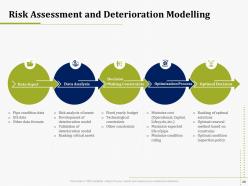
Risk Assessment and Deterioration Modelling
-
Optimization and Decision Making
-
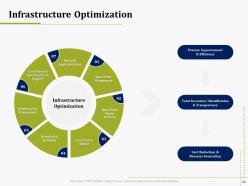
Infrastructure Optimization
-
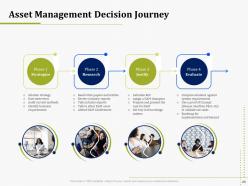
Asset Management Decision Journey
-
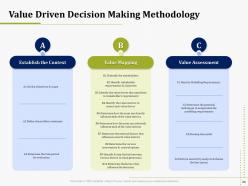
Value Driven Decision Making Methodology
-
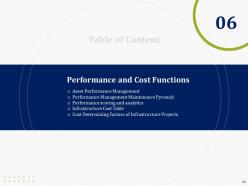
Performance and Cost Functions
-
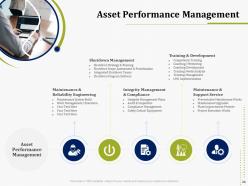
Asset Performance Management
-
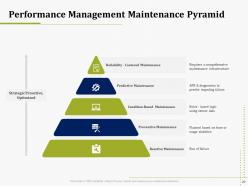
Performance Management Maintenance Pyramid
-
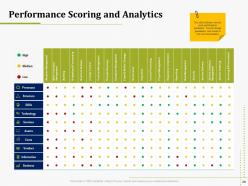
Performance Scoring and Analytics
-
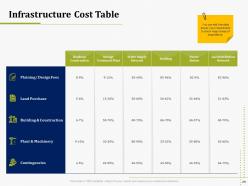
Infrastructure Cost Table
-
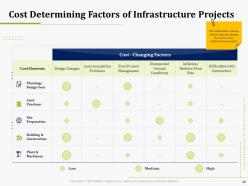
Cost Determining Factors of Infrastructure Projects
-
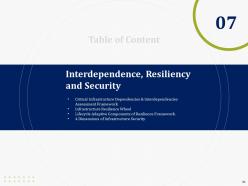
Interdependence Resiliency and Security
-
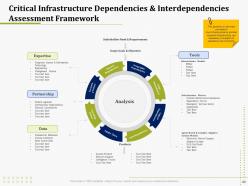
Critical Infrastructure Dependencies Interdependencies Assessment Framework
-
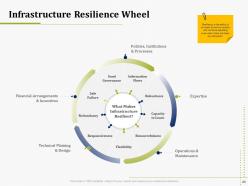
Infrastructure Resilience Wheel
-
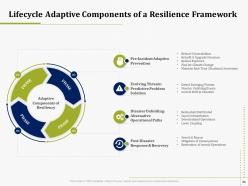
Lifecycle Adaptive Components of a Resilience Framework
-
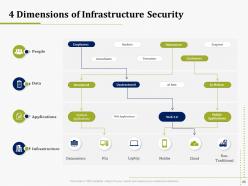
4 Dimensions of Infrastructure Security
-
Contract and Workflow Management
-
Key Components of Contract Management
-
Contract Lifecycle Management
-
Workflow Management Process
-
Commissioning New Facilities
-
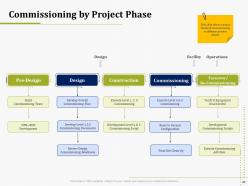
Commissioning by Project Phase
-
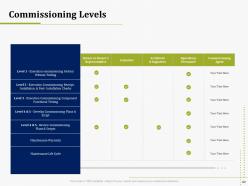
Commissioning Levels
-
Capital Budgeting
-
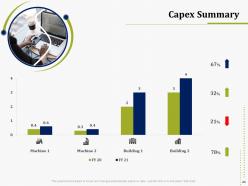
Capex Summary
-
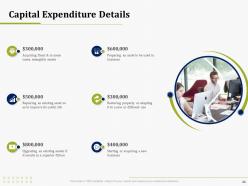
Capital Expenditure Details
-
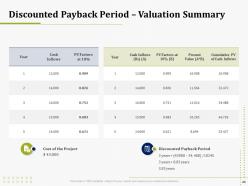
Discounted Payback Period Valuation Summary
-
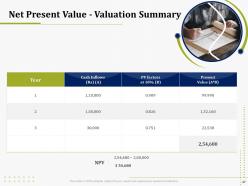
Net Present Value Valuation Summary
-
Internal Rate of Return Valuation Summary
-
Valuation Methods Comparison
-
KPI Metrics and Dashboard
-
Infrastructure KPI Dashboard Showing Cost Reduction Procurement
-
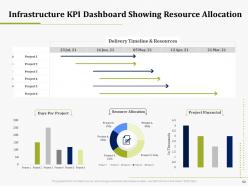
Infrastructure KPI Dashboard Showing Resource Allocation
-
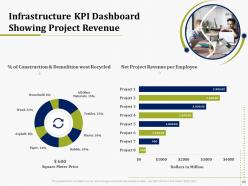
Infrastructure KPI Dashboard Showing Project Revenue
-
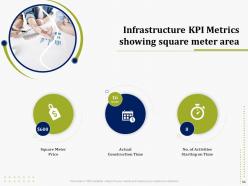
Infrastructure KPI Metrics showing square meter area
-
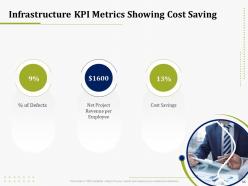
Infrastructure KPI Metrics Showing Cost Saving
-
IT Operations Management Icons Slide
-
Additional Slides
-
Infrastructure Industry Key Stats
-
Comparison
-
Our Mission
-
Idea Generation
-
Financial
-
Clustered Bar Chart
-
Post It Notes
-
Timeline
-
30 60 90 Days Plan
-
Thanks for Watching
FAQs for It operations management
Honestly, start by figuring out what's currently broken - audit your setup and find the biggest headaches first. Monitoring and alerts are huge so you catch problems before your users start complaining. You'll want solid incident management for when stuff inevitably goes wrong, plus change management so nobody accidentally nukes production on a Friday (been there). Capacity planning keeps you ahead of growth, and automate whatever you can because manual work sucks. Don't skip performance tracking and service levels either - gotta know if you're actually meeting business needs.
Honestly, just pick 3-5 metrics that actually move the needle. Response times and uptime are obvious ones. MTTR and MTBF will tell you way more than most other stuff - they show if your systems actually work when they need to. User satisfaction surveys matter too since that's what the bosses care about anyway. I've watched teams go crazy tracking like 20 different KPIs and it's just noise. Build your dashboards around the core metrics first, then maybe add more later if you need them. Way easier to start simple.
Dude, automation seriously saves your sanity in IT ops. You can set it up to handle all the boring stuff - server monitoring, patches, backups, incident responses. No more checking logs at 3am (worst part of the job honestly). When something breaks, automated systems spot it fast and kick off fixes before you even know there's a problem. Your team stops playing whack-a-mole with issues. Fewer mistakes happen too since humans aren't doing the repetitive grunt work. Just pick one annoying process first and automate that.
Build adaptability into your IT ops from day one. Get continuous monitoring tools that catch anomalies as they happen, and keep your incident response playbooks fresh - threats evolve constantly. Automate your security patching (trust me, manual patching is a nightmare). Keep that asset inventory current too. Your team should run tabletop exercises regularly to practice different attack scenarios. Oh, and audit your monitoring gaps first - that's usually how attackers sneak in. The threat landscape moves crazy fast these days, so staying reactive just doesn't cut it anymore.
Honestly, it's all about having a solid process and actually following it. Define your severity levels upfront. Know who calls who when things go sideways - seriously, nothing's worse than scrambling to find contact info at 2 AM. Document everything as it happens because stakeholders will definitely come asking questions later. Post-incident reviews are huge too, that's where you actually learn what broke down instead of just putting out the same fires repeatedly. Oh and make sure everyone knows their role beforehand. Sounds obvious but you'd be surprised how often that gets overlooked.
So ITIL is basically like having a playbook for IT stuff - handles incidents, changes, service delivery, all that. Without it, everyone just wings it and things get chaotic real quick. You'll get way better at prioritizing problems and actually showing the business why IT matters through proper service catalogs. Honestly, the incident management part alone is worth it since that's usually where teams are drowning. Makes everything less of a fire drill, you know? I'd start there first - you'll see improvements pretty fast and it's not as overwhelming as trying to implement everything at once.
So basically you want to track four main things: uptime, how fast everything responds, resource usage (CPU/memory/storage), and stuff like how quickly you resolve tickets. Don't go crazy tracking every possible metric though - I've seen teams drown in data they never actually look at. Start with automated monitoring for system health, measure response times from your users' perspective, and track how long it takes to fix issues. Honestly, pick like 5-7 metrics that actually matter to your business and check them regularly. Way better than having 50 dashboards nobody uses.
First thing - actually talk to the business people regularly and figure out what they're trying to accomplish. I know, sounds basic, but IT teams love working in their own bubble. Connect your services to real business outcomes instead of just tech stuff. Meet with leadership often because priorities change constantly - I've watched teams build entire systems that became useless because nobody told them the strategy shifted. Your monitoring should track things that affect customers or revenue, not just server uptime. Oh, and when things break? Fix what hurts the business first, not whatever looks scariest in your logs.
Honestly, start by figuring out what's driving you crazy right now - that's your priority. For monitoring, you can't go wrong with Datadog or New Relic to watch your infrastructure. Ansible and Terraform will save your life for deployments (seriously, automation is everything). If you're dealing with tickets and workflows, ServiceNow works but there are cheaper options too. AWS CloudWatch or Azure Monitor are obvious choices if you're already in those clouds. Oh, and don't sleep on log aggregation - Splunk's pricey but the ELK stack does the job. Audit what you've got first though.
Dude, cloud computing totally changes everything about IT ops. You're not babysitting physical servers anymore - now it's all APIs, auto-scaling, and trying not to cry when you see your AWS bill. The shift from hardware to services is honestly pretty overwhelming at first. Your monitoring gets way more complicated since everything's distributed, but at least you can actually see what's happening with costs and performance. Oh, and forget treating servers like precious snowflakes - they're disposable now. Infrastructure-as-code becomes your religion. Start with automating deployments though, that's where you'll build everything else from.
Honestly, just get people talking to each other instead of lobbing tickets back and forth like grenades. Start with daily standups between dev and ops - sounds basic but it actually works. Set up shared dashboards so everyone's seeing the same metrics instead of arguing about whose numbers are right. I'd try pairing developers with ops engineers on small stuff first, builds empathy way faster than any workshop. Pick one tiny pilot project where both teams sink or swim together. Oh, and get your CI/CD pipeline sorted so it's not this frankenstein monster that only three people understand.
Look, good IT ops is basically what keeps your customers from wanting to throw their phones at the wall. When your apps are fast and your systems don't crash every other Tuesday, people can actually get stuff done without losing their minds. I've watched companies tank because they ignored this stuff - it's brutal. Your ops team is literally preventing those nightmare scenarios where everything breaks at once. Short answer? Set up solid SLAs and have a game plan for when things go sideways. Systems that work smoothly usually equal customers who don't hate you.
Honestly, the cultural stuff is brutal - people hate giving up their silos. Your tools probably won't talk to each other either, which is super annoying when you're trying to integrate monitoring and deployment systems. Plus ops teams suddenly need to code, which... yeah, that's a learning curve. Oh, and developers have to actually care about production (good luck with that). Start with just one team or app though. Prove it works there first, then slowly expand. I've seen companies try to flip everything at once and it's a disaster.
Dude, get yourself a decent ITSM tool first - spreadsheets are basically change management suicide. Set up different workflows for emergency vs standard vs normal changes since they're totally different beasts. For routine stuff like patches, create pre-approved templates so you're not reinventing the wheel every time. Risk assessments upfront will save your ass later, trust me. Track your success rates and how fast you can roll things back when stuff inevitably goes sideways. Oh, and actually communicate what's happening - shocking concept, right? Most teams skip this and wonder why everyone's confused.
AI/ML automation is eating up routine monitoring tasks - happening faster than most people realize. Edge computing's the other big shift since processing keeps moving closer to users, completely flipping how we handle distributed stuff. Traditional monitoring is basically dead now. Observability platforms give you actual insight into what's going wrong (finally). Serverless and infrastructure-as-code aren't trendy anymore - they're just how things work. My advice? Pick one boring task you hate doing and automate it. Or mess around with an observability tool for a weekend. Don't overthink it though - just start somewhere and build from there.
-
Graphics are very appealing to eyes.
-
Great quality slides in rapid time.
-
Innovative and Colorful designs.
-
Perfect template with attractive color combination.
-
Wonderful templates design to use in business meetings.
-
The content is very helpful from business point of view.
-
Commendable slides with attractive designs. Extremely pleased with the fact that they are easy to modify. Great work!
-
Thanks for all your great templates they have saved me lots of time and accelerate my presentations. Great product, keep them up!
-
Enough space for editing and adding your own content.
-
The content is very helpful from business point of view.