

Business Operations Powerpoint Presentation Slides






Try Before you Buy Download Free Sample Product
 Impress Your
 Audience
 100%
100% Editable
 Save Hours
 of Time


Outline the strategies related to business activities and day-to-day functions by using our Business operations PowerPoint Presentation Slides. With the help of our professionally designed business development PPT template mention the important features such as operational excellence, customer intimacy, and product leadership. There are different stages included in our business operations PowerPoint slides which help you to implement your work on the basis of the initial stage, planning stage, execution stage, limitation, and relationship stage. The quality management presentation deck helps in improving, monitoring, maintenance, traceability, sustainability, and presentation of the specified data. Identify the cost report of your entire project, using high-rated icons, charts, sheets, and graphs that are present in our operations management PPT presentation slides. This business process management PowerPoint deck depicts the process of supply chain management which includes its components, KPI dashboards, goals, advantages, etc. Therefore, download our ready-to-use Operations Management ppt and bifurcate the strategies.
People who downloaded this PowerPoint presentation also viewed the following :
Content of this Powerpoint Presentation
Slide 1: This slide introduces Business Operations. State Your Company Name and begin.
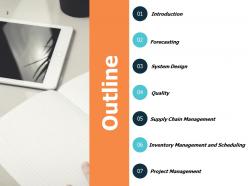
Slide 2: This slide shows Outline of the presentation.
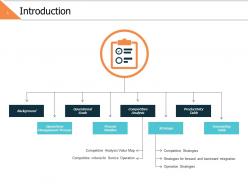
Slide 3: This slide presents Introduction describing- Forecasting Table, Productivity Table, Strategy, Competitive Analysis, Process Timeline, Operational Goals, Operations Management Process, Background.
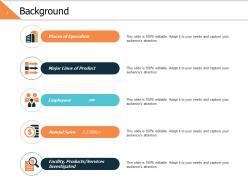
Slide 4: This slide displays Background describing- Places of Operation, Major Lines of Product, Employees, Facility, Products/Services Investigated, Annual Sales.
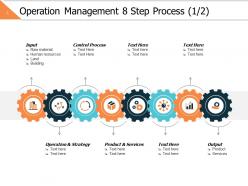
Slide 5: This slide represents Operation Management 8 Step Process. You can add data as per requirements.
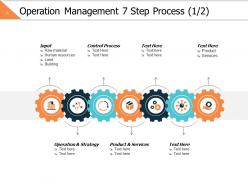
Slide 6: This slide showcases Operation Management 7 Step Process with icons and text boxes.
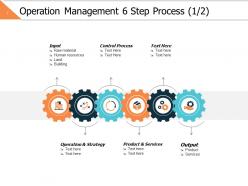
Slide 7: This slide shows Operation Management 6 Step Process. You can add or edit data as per requirements.
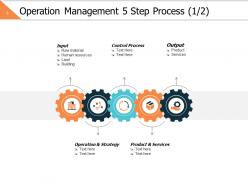
Slide 8: This slide presents Operation Management 5 Step Process.
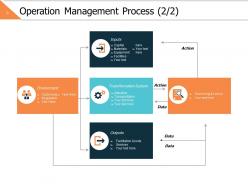
Slide 9: This slide displays Operation Management Process describing- Monitoring & Control, Inputs, Transformation System, Outputs, Environment.
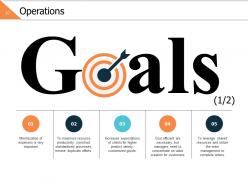
Slide 10: This slide represents Operations Goals with related imagery and text.
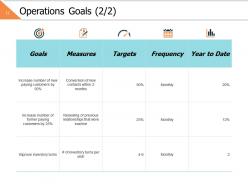
Slide 11: This is another slide for Operations Goals describing- Goals, measures, targets, frequency and year to date.
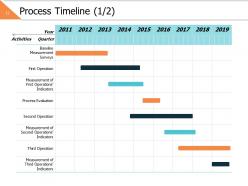
Slide 12: This slide showcases Process Timeline on yearly and quarterly basis. You can add or edit data as per needs.
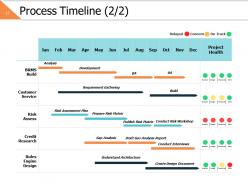
Slide 13: This is another slide displaying Process Timeline on monthly basis.
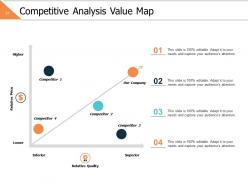
Slide 14: This slide shows Competitive Analysis Value Map comparing quality and price.
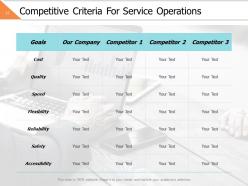
Slide 15: This slide displays Competitive Criteria For Service Operations.
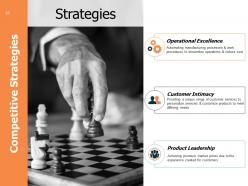
Slide 16: This slide presents Competitive Strategies describing- Operational Excellence, Customer Intimacy, Product Leadership.
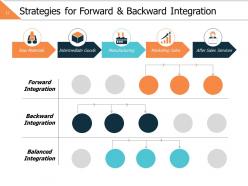
Slide 17: This slide represents Strategies for Forward & Backward Integration describing- Raw Materials, Intermediate Goods, Manufacturing, Marketing Sales, After Sales Services.
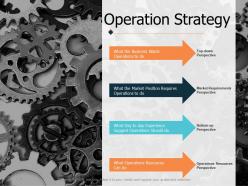
Slide 18: This slide showcases Operation Strategy with- Top-down Perspective, Market Requirements Perspective, Bottom-up Perspective, Operations Resources Perspective.
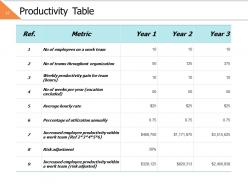
Slide 19: This slide shows Productivity Table. You can change the data as per requirements.
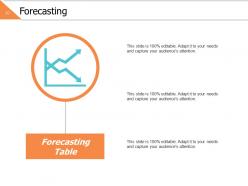
Slide 20: This slide presents Forecasting with related diagram and additional text boxes to show information.
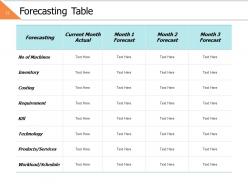
Slide 21: This slide displays Forecasting Table on monthly basis.
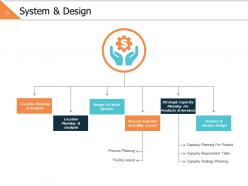
Slide 22: This slide represents System & Design describing- Product & Service Design, Strategic Capacity Planning for Products & Services, Process Selection & Facility Layout, Design of Work System, Location Planning & Analysis.
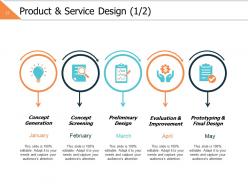
Slide 23: This slide showcases Product & Service Design describing- Concept Generation Concept Screening Evaluation & Improvement Prototyping & Final Design Preliminary Design
Slide 24: This is another slide for Product & Service Design describing- Assets, People, Culture and Policy.
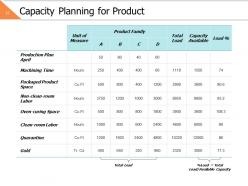
Slide 25: This slide shows Capacity Planning for Product.
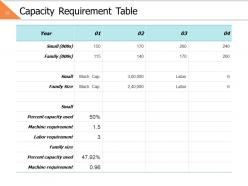
Slide 26: This slide presents Capacity Requirement Table. You can change the data as per needs.
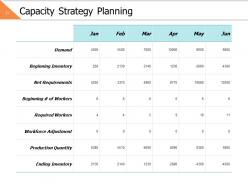
Slide 27: This slide displays Capacity Strategy Planning in tabular form.
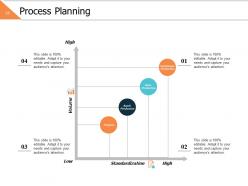
Slide 28: This slide represents Process Planning comparing standardization and volume.
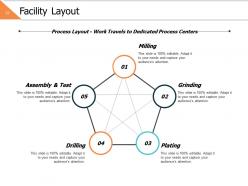
Slide 29: This slide showcases Facility Layout describing- Milling, Assembly & Test, Drilling, Plating, Grinding.
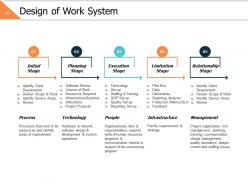
Slide 30: This slide shows Design of Work System describing- Process, Technology, People, Infrastructure, Management.
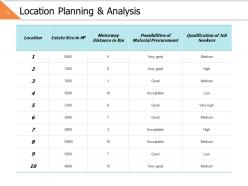
Slide 31: This slide presents Location Planning & Analysis in tabular form with categories as- Location, Estate size, Motorway distance, Possibilities of material procurement and Qualification of Job Seekers.
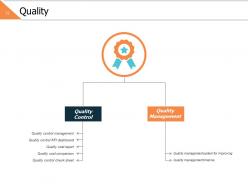
Slide 32: This slide is titled as Quality describing Quality management and Quality control.
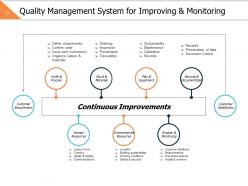
Slide 33: This slide displays Quality Management System for Improving describing- Verify & Process, Stock & Materials, Plan & Equipment, Records & Documentation, Human Resources, Environmental Resources, Analysis & Monitoring.
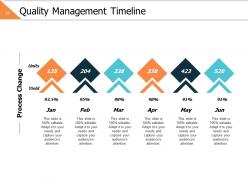
Slide 34: This slide represents Quality Management Timeline on monthly basis.
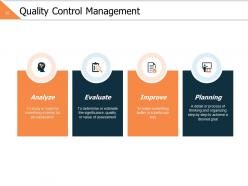
Slide 35: This slide showcases Quality Control Management Planning, Analyze, Evaluate, Improve.
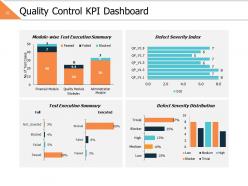
Slide 36: This slide presents Quality Control KPI Dashboard showing data in forms of graph.
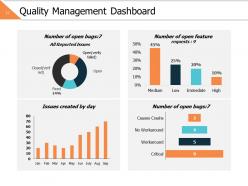
Slide 37: This slide shows Quality Management Dashboard with chart and bar graphs.
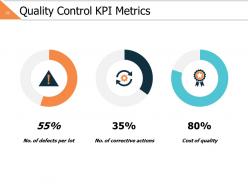
Slide 38: This slide displays Quality Control KPI Metrics describing- No. of defects per lot, No. of corrective actions, Cost of quality.
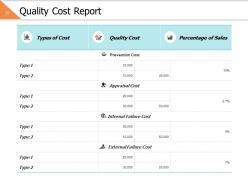
Slide 39: This slide represents Quality Cost Report in tabular form with categories as- Types of Cost, Quality Cost, Percentage of Sales.
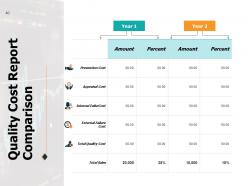
Slide 40: This slide showcases Quality Cost Report Comparison on yearly basis.
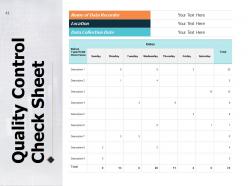
Slide 41: This slide shows Quality Control Check Sheet.
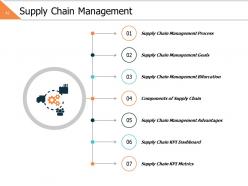
Slide 42: This slide presents Supply Chain Management describing- Supply Chain Management Process, Supply Chain KPI Dashboard, Supply Chain Management Bifurcation, Supply Chain Management Goals, Components of Supply Chain, Supply Chain Management Advantages, Supply Chain KPI Metrics.
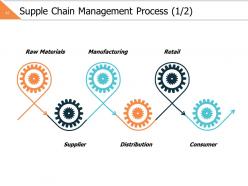
Slide 43: This slide displays Supply Chain Management Process describing- Raw Materials, Supplier, Manufacturing, Retail, Consumer.
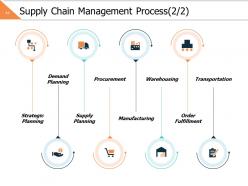
Slide 44: This is another slide displaying Supply Chain Management Process.
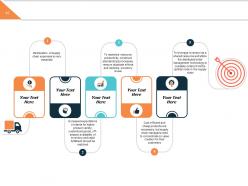
Slide 45: This slide represents Supply Chain Management Goals with related icons and text.
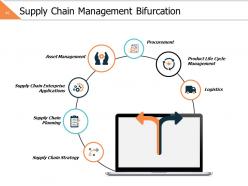
Slide 46: This slide showcases Supply Chain Management Bifurcation describing- Supply Chain Strategy, Supply Chain Planning, Supply Chain Enterprise Applications, Asset Management, Logistics, Product Life Cycle Management, Procurement.
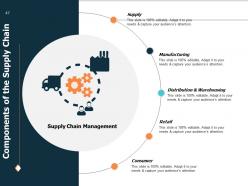
Slide 47: This slide shows Components of the Supply Chain describing- Supply, Manufacturing, Retail, Consumer, Distribution & Warehousing.
Slide 48: This slide presents Supply Chain Management Advantages.
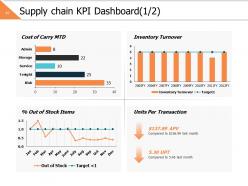
Slide 49: This slide displays Supply chain KPI Dashboard with the help of graphs.
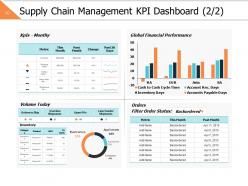
Slide 50: This is another slide displaying Supply Chain Management KPI Dashboard.
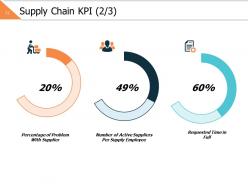
Slide 51: This slide represents Supply Chain KPI describing- Percentage of Problem With Supplier, Number of Active Suppliers Per Supply Employee, Requested Time In Full.
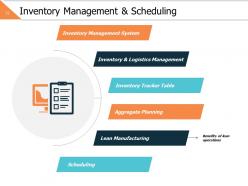
Slide 52: This slide displays Inventory Management & Scheduling describing- Inventory Management System, Scheduling, Inventory Tracker Table, Inventory & Logistics Management, Aggregate Planning, Lean Manufacturing.
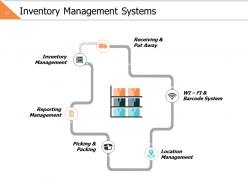
Slide 53: This slide represents Inventory Management Systems describing- Picking & Packing, Reporting Management, Receiving & Put Away, WI – FI & Barcode System, Location Management, Inventory Management.
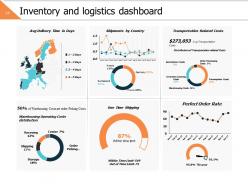
Slide 54: This slide showcases Inventory and logistics dashboard describing- One Time Shipping, Avg Delivery Time in Days, Warehousing Operating Costs distribution, Transportation Related Costs, Shipments by Country.
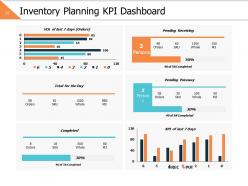
Slide 55: This slide shows Inventory Planning KPI Dashboard.
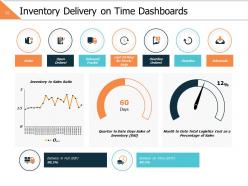
Slide 56: This slide presents Inventory Delivery on Time Dashboards.
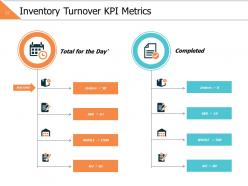
Slide 57: This slide displays Inventory Turnover KPI Metrics.
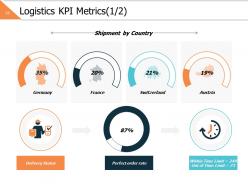
Slide 58: This slide represents Logistics KPI Metrics describing- Shipment by Country, Perfect order rate, Delivery Status.
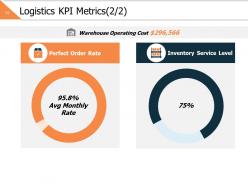
Slide 59: This is another slide representing Logistics KPI Metrics.
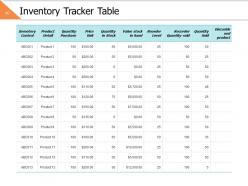
Slide 60: This slide showcases Inventory Tracker Table. You can add or edit data as per requirement.
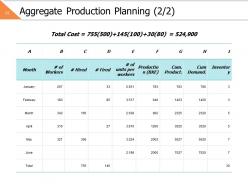
Slide 61: This slide shows Aggregate Production Planning in tabular form.
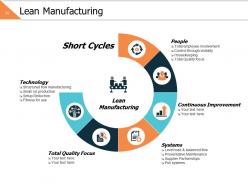
Slide 62: This slide presents Lean Manufacturing describing- People, Total Quality focus, Continuous Improvement, Systems, Technology, Short Cycles.
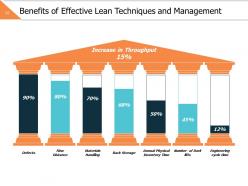
Slide 63: This slide displays Benefits of Effective Lean Techniques and Management.
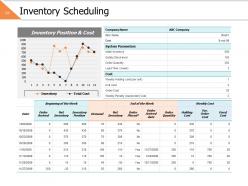
Slide 64: This slide represents Inventory Scheduling with help of tables and graph.
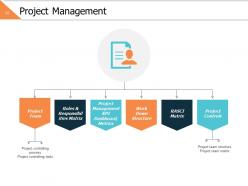
Slide 65: This slide showcases Project Management describing- Project Controls, RASCI Matrix, Work Down Structure, Project Management KPI Dashboard, Metrics, Roles & Responsibilities Matrix, Project Team.
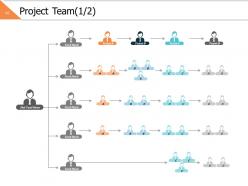
Slide 66: This slide shows Project Team in hierarchy form.
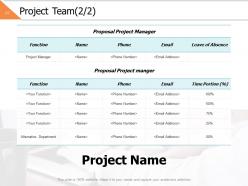
Slide 67: This is another slide presenting Project Team.
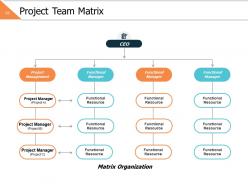
Slide 68: This slide presents Project Team Matrix with designation.
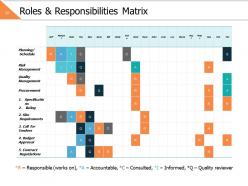
Slide 69: This slide displays Roles & Responsibilities Matrix.
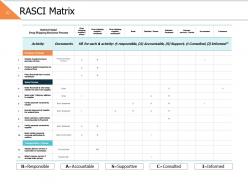
Slide 70: This slide represents RASCI Matrix describing person Responsible, Accountable, Consulted, Informed, Supportive.
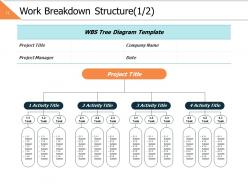
Slide 71: This slide showcases Work breakdown Structure in form of tree diagram.
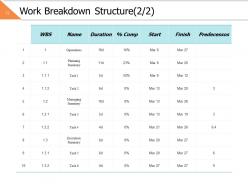
Slide 72: This is another slide showing Work breakdown Structure.
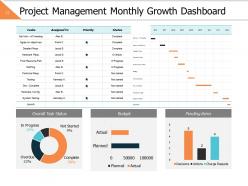
Slide 73: This slide presents Project Management Monthly Growth Dashboard.
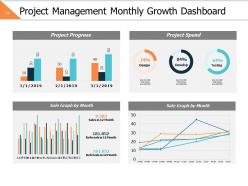
Slide 74: This is another slide showing Project Management Monthly Growth Dashboard.
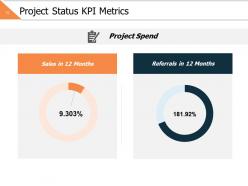
Slide 75: This slide displays Project Status KPI Metrics with sales on monthly basis.
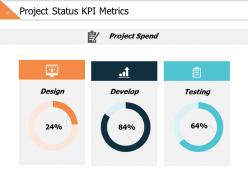
Slide 76: This slide represents Project Status KPI Metrics with project expenditure.
Slide 77: This slide showcases Project Controlling Process with related diagram.
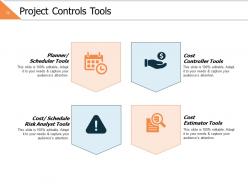
Slide 78: This slide shows Project Controls Tools describing- Planner/ Scheduler Tools, Cost Controller Tools, Cost/Schedule Risk Analyst Tools, Cost Estimator Tools.
Slide 79: This is a Thank You slide with address, contact numbers and email address.
Business Operations Powerpoint Presentation Slides with all 79 slides:
Use our Business Operations Powerpoint Presentation Slides to effectively help you save your valuable time. They are readymade to fit into any presentation structure.





FAQs for Business Operations
Honestly, start by mapping what you're actually doing now - most people skip this and wonder why nothing works. Your biggest wins come from fixing supply chain stuff because that's where everything falls apart. Get your workflows documented so people aren't constantly asking "wait, how do we do this again?" Technology helps but only if your team knows how to use it. Quality control and performance tracking are non-negotiable. Oh and communication - if your team can't talk to each other properly, good luck with everything else. Focus on whatever bottleneck is making you want to throw your laptop out the window first.
Honestly, just start with whatever's driving you crazy right now. Maybe it's tracking expenses or keeping customer info straight - there's probably an app for that. Cloud tools are great because your team can work from literally anywhere (learned that the hard way during covid). Automate the boring stuff first. Invoicing, expense reports, all those repetitive tasks that make you want to pull your hair out. CRM systems beat the hell out of random spreadsheets for customer data. Don't go overboard though - pick one thing, get it working, then add more later. You'll actually use it that way.
Dude, analytics is like having superpowers for your business - you can actually see what's breaking instead of just winging it. Track when machines might crap out, find where you're bleeding time and money, spot which team shifts crush it vs the ones that drag. Honestly, the patterns that show up will blow your mind. Like why does Tuesday always suck for productivity? Or why does that one process always jam up at the same spot? I'd start small though - pick maybe 2-3 things you actually care about day-to-day and just watch those numbers for a while.
Start by figuring out which daily tasks actually connect to your big-picture goals. Like, does this process help cut costs or make customers happier? Set up KPIs that show real impact on what matters most. Those cross-department meetings are clutch - even if they feel like a drag sometimes. Your front-line people need to get why their work matters beyond just checking boxes. I'd do quarterly check-ins to see if you're still on track. Honestly, most companies skip this part and wonder why nothing changes. Short meetings work better than long ones too.
Oh man, you're gonna deal with supply chain chaos, cash flow headaches, and keeping good people around - it's like constant firefighting mode. I'd diversify suppliers and stock up on buffer inventory when you can. Cash flow gets smoother with better forecasting plus negotiating payment terms with clients. The talent stuff is brutal since everyone's fighting for the same people, but training investments and actually listening to what employees say makes a difference. Honestly though, figure out which one's killing you most right now and hit that first.
Look, when your supply chain runs smoothly, everything else just clicks into place. Materials flow better, costs drop, and you're not constantly putting out fires. It's wild how much one bottleneck can mess up your whole operation - from production delays to angry customers. I've seen companies waste so much money because they couldn't see problems coming. You really need visibility into each step so you can catch issues early. Think of it like this: good supply chain management keeps everything lean and fast, while bad management creates chaos that spreads everywhere.
Honestly, good training fixes so many problems at once. Your team makes way fewer mistakes when they actually know their stuff. Processes move faster too since people aren't fumbling around trying to figure things out. Managers can focus on bigger picture stuff instead of constantly babysitting. Customer service gets better automatically. Oh, and people stick around longer because they feel competent - which saves you from that whole hiring nightmare again. I'd start by looking at where you're bleeding the most operationally and build training around fixing those specific issues first.
Look, don't overthink this stuff. Start with the basics - how long things take, error rates, and whether customers are actually happy. Revenue per employee is solid too. Honestly, most companies track way too much and then can't figure out what matters. Pick maybe 3-5 things that actually connect to making money or keeping customers around. On-time delivery is usually a good one. Once you get those dialed in, you can always add more specific metrics if you notice certain areas going sideways. But seriously, keep it simple at first.
Look, first thing - figure out where you're bleeding money on energy and materials. That's your starting point. Going renewable helps, but honestly the supply chain stuff might be easier? Work with local vendors when you can. Less shipping = less emissions. Digital everything instead of printing a million copies. Should've happened ages ago but whatever. Recycling programs are pretty straightforward to set up too. Pick one thing first though - maybe packaging waste since that's visible. Track it monthly so you actually know if it's working. Then expand once you've got momentum going.
So basically you're always hunting for little tweaks to make things run smoother. Costs go down, quality goes up, customers are happier - the usual wins. But here's what I didn't expect: your team actually gets way more into their work because they're solving stuff instead of just... existing? Way better than the zombie routine most places have going. You'll spot problems early before they blow up your budget. Plus you stay ahead of competitors who are still doing things the 2019 way. My advice though - don't try to fix everything at once. Just pick that one annoying process everyone complains about and start there.
Honestly, cross-functional teams are game changers because they kill those stupid departmental silos. Your marketing person actually talks to ops and finance instead of everything going through three layers of management first. Problems get spotted way earlier since everyone sees the whole project, not just their tiny slice. I've seen it work really well when roles are clear upfront - otherwise you get that "too many chefs" mess. Finance people understanding marketing constraints? Revolutionary, I know. Start with one small project first. Once people see how much faster things move, they'll be sold on the idea.
Honestly, start with Asana or Monday.com for project management - you'll lose your mind without something to track deadlines. Slack is a game changer for team chat, way better than drowning in email threads. QuickBooks handles your accounting stuff, and HubSpot's solid for managing customers. Oh, and you'll need cloud storage - Google Drive or Dropbox, whatever. Notion's pretty cool for keeping all your processes in one spot, though it can get overwhelming if you go crazy with it. But seriously, don't try to implement everything at once. Get the project management and communication tools running first, then add the rest as you figure out what you actually need.
Look, customer feedback is basically your roadmap for fixing what's actually broken. Instead of guessing what people hate, you're getting the real deal straight from them. Use it to figure out which fires to put out first and where to throw your resources. The patterns will show you bottlenecks and workflow issues you probably didn't even know existed. Honestly, it beats sitting around making assumptions any day. Just make sure you're collecting feedback from different places – surveys, social media, whatever – and actually do something with it once you spot the trends. Otherwise you're just hoarding complaints for no reason.
Honestly, get decent inventory software first - tracking stuff in real-time will change your life. Set up reorder points so you're not scrambling when things run low. Instead of doing those brutal yearly counts, just cycle through sections regularly. ABC analysis is clutch too - spend most of your energy on the expensive stuff that actually matters. Don't rely on just one supplier either, that's asking for trouble. Keep safety stock for your bestsellers obviously. Oh, and the data you'll get from automated tracking? Way better than guessing. Trust me on that one.
Do a proper risk assessment first - figure out what'll actually mess up your business, not imaginary problems. When our main supplier disappeared for three days, I realized how screwed we were without backup plans. Map your critical stuff and spot the weak points. Get monitoring systems running so you catch problems early instead of panicking later. Honestly, most companies only think about this when disaster strikes, which is backwards. Build redundancy for key suppliers, systems, and people. The trick is weaving risk management into daily operations rather than treating it like some quarterly checklist item.
-
Unique research projects to present in meeting.
-
Excellent products for quick understanding.
-
Great experience, I would definitely use your services further.
-
Awesome use of colors and designs in product templates.