

Business Operations Strategy Model Powerpoint Presentation Slides





Try Before you Buy Download Free Sample Product
 Impress Your
 Audience
 100%
100% Editable
 Save Hours
 of Time


Want to analyse weekly organization performance review? Finding difficulty in making agenda for more efficient and effective operations. Here we are to help you with business operations strategy model PowerPoint presentation slides. This operational management presentation would be helpful in presenting and reviewing the business operations of the company. Our change management model PPT templates contains various slides on firm operations summary, milestones achieved, company objectives, firm challenges, partnering & alliance challenges, effective firm partnerships, risk mitigation strategies, product roadmap, competitive landscape, key performance indicators, new customer acquisition cost, customer’s lifetime value, operating plan and selection plan for the organisation to ensure smooth management operations. Our value chain analysis presentation slide designing and research team have done all the hard work for you. You can deploy the same supply chain management PowerPoint presentation for the topics like business strategy process model, organizational strategy operating model, strategic management, business operating system, strategic planning, business operational management, project production management, etc. So quickly download this business operations strategy model PowerPoint presentation.Arrive at correct inferences with our Business Operations Strategy Model Powerpoint Presentation Slides. Examine events in a chronological fashion.
People who downloaded this PowerPoint presentation also viewed the following :
Content of this Powerpoint Presentation
Slide 1: This slide introduces to Business Operations Strategy Model. State Your Company Name and get started.
Slide 2: This slide presents Business Operations Summary Table of Contents. The content include- Operational Highlights, Milestones Achieved, Company Objectives, Operational Challenges, Partnering & Alliance Challenges, Checklist for Effective Business Partnerships, Risk Associated With Strategic Alliances, Organizational / Operational Setup Challenges, Operational Setup-Risk & Mitigation, Customer Service Related Challenges, Business Risk Associated With Customer Service, Risk Mitigation Strategies For Customer Service, Current Sources of Revenue, Risk Associated With Sales & Marketing, Company Strategy, Product Roadmap, Changes in Competitive Roadmap, Key Performance Indicators, Financial Summary: Base vs Stretch Plan, New Customer Acquisition Cost, Customer Lifetime Value, Calculating Customer Lifetime Value (CLV), Operating Plan, Hiring Plan, Risk Mitigation Strategies, Sales & Marketing Challenges, Potential Sources of Revenue.
Slide 3: This is Our Agenda slide. State your agendas here.
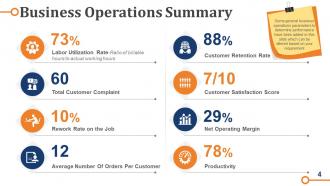
Slide 4: This slide introduces Business Operations Summary. Some general business operations parameters to determine performance have been added in this slide which can be altered based on your requirement. The Summary points are- Labor Utilization Rate, Total Customer Complaint, Rework Rate on the Job, Average Number Of Orders Per Customer, Customer Retention Rate, Customer Satisfaction Score, Net Operating Margin, Productivity.
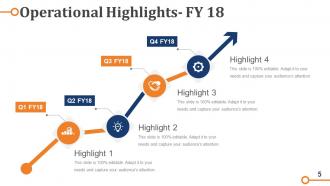
Slide 5: This slide displays Operational Highlights for FY 18 divided into 4 quarters.
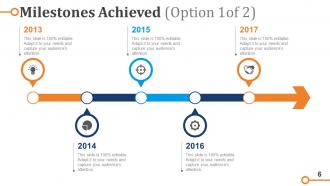
Slide 6: This slide presents Milestones Achieved. State milestones, growth highlights etc. here.
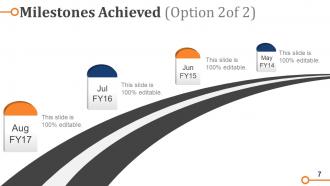
Slide 7: This slide also presents Milestones Achieved. State milestones, growth highlights etc. here.
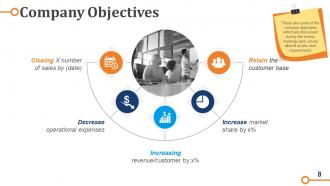
Slide 8: This slide presents Company Objectives. Some examples given are- Retain the current customer base, Increase market share by x%, Increasing revenue/customer by x%, Closing X number of sales by (date), Decrease operational expenses.
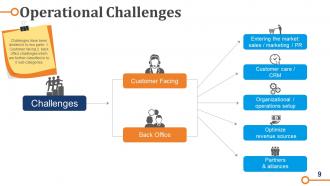
Slide 9: This slide showcases Operational Challenges with two main sub headings- Customer Facing and Back Office. Challenges have been divided in to two parts: 1. Customer facing 2. back office challenges which are further classified in to 5 sub-categories. Entering the market: sales / marketing / PR, Customer care / CRM, Organizational / operations setup, Optimize revenue sources, Partners & alliances.
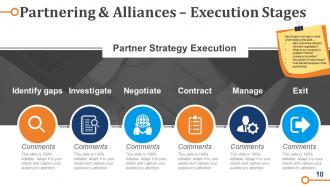
Slide 10: This slide presents Partnering & Alliances: Execution Stages. The listed stages of Partner Strategy Execution are- Identify gaps, Investigate, Negotiate, Contract, Manage, Exit.
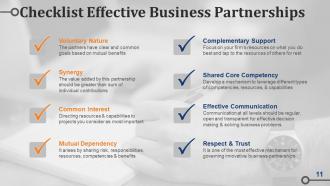
Slide 11: This slide consists of Checklist Effective Business Partnerships. The subheadings include- Voluntary Nature, Synergy, Common Interest, Mutual Dependency, Complementary Support, Shared Core Competency, Effective Communication, Respect & Trust.
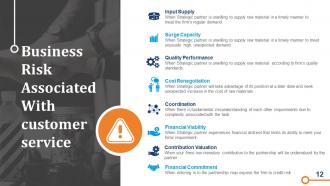
Slide 12: This slide presents Business Risk Associated With customer service with the following subheadings- Contribution Valuation, Financial Viability, Cost Renegotiation, Quality Performance, Surge Capacity, Coordination, Input Supply, Financial Commitment.
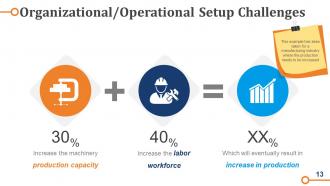
Slide 13: This slide presents Organizational/Operational Setup Challenges. The listed ones are- Increase the machinery production capacity, and Increase the labor workforce as examples.
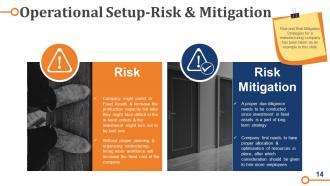
Slide 14: This slide showcases Operational Setup-Risk & Mitigation with the subheadings of- Risk and Risk Mitigation.
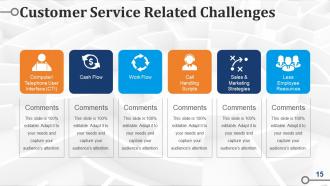
Slide 15: This slide shows Customer Service Related Challenges. The subheadings include- Cash Flow, Computer/ Telephone User Interface (CTI), Work Flow, Call Handling Scripts, Sales & Marketing Strategies, Less Employee Resources.
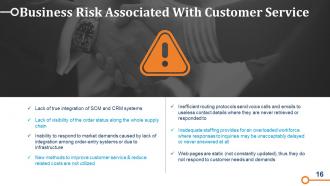
Slide 16: This slide presents Business Risk Associated With Customer Service.
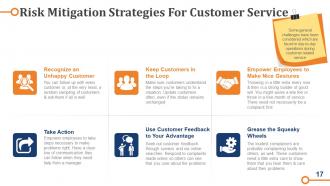
Slide 17: This slide showcases Risk Mitigation Strategies For Customer Service. The main strategies include- Take Action, Recognize an Unhappy Customer, Keep Customers in the Loop, Use Customer Feedback to Your Advantage, Empower Employees to Make Nice Gestures, Grease the Squeaky Wheels.
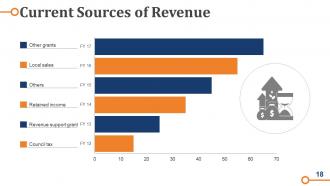
Slide 18: This slide displays Current Sources of Revenue such as- Other grants, Local sales, Others, Revenue support grant, Retained income, Council tax.
Slide 19: This is a Coffee Break image slide to halt. You may change the slide contents as per need.
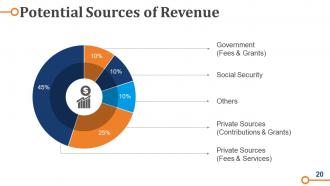
Slide 20: This slide lists Potential Sources of Revenue- Social Security, Government (Fees & Grants), Others, Private Sources (Contributions & Grants), Private Sources (Fees & Services).
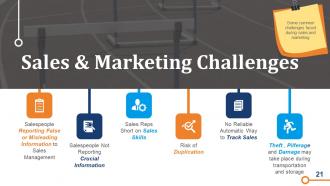
Slide 21: This slide shows Sales & Marketing Challenges. It lists some common challenges faced during sales and marketing. They are- Salespeople Reporting False or Misleading Information to Sales Management, Sales Reps Short on Sales Skills, Risk of Duplication, Theft , Pilferage and Damage may take place during transportation and storage, No Reliable Automatic Way to Track Sales, Salespeople Not Reporting Crucial Information.
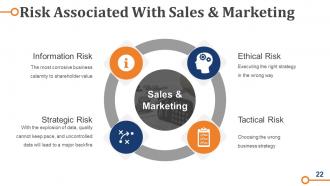
Slide 22: This slide showcases Risk Associated With Sales & Marketing. The main risks shown are- Tactical Risk, Ethical Risk, Strategic Risk, Information Risk.
Slide 23: This slide shows Company Strategy. State your strategy here.
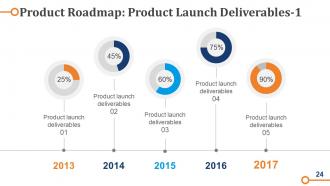
Slide 24: This slide shows a Product Roadmap: Product Launch Deliverables. State deliverables here.
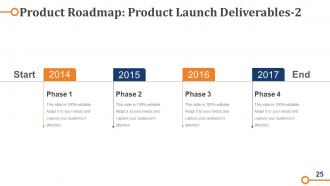
Slide 25: This slide shows another Product Roadmap: Product Launch Deliverables. State deliverables here.
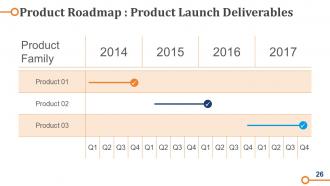
Slide 26: This slide too shows another Product Roadmap: Product Launch Deliverables. State deliverables here.
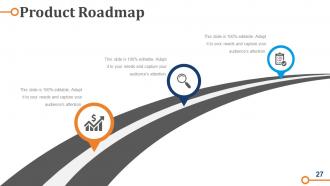
Slide 27: This slide showcases a Product Roadmap with imagery to go with. State milestones, growth highlights etc. here.
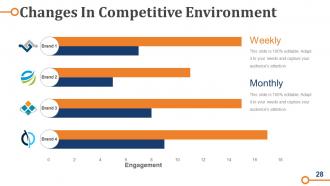
Slide 28: This slide shows Changes In Competitive Environment of weekly and monthly basis.
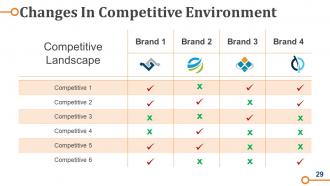
Slide 29: This slide showcases Changes In Competitive Environment matrix table.
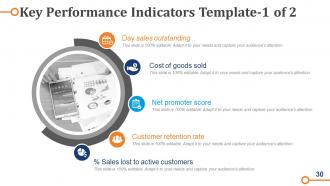
Slide 30: This slide presents Key Performance Indicators. The listed indicators are- Day sales outstanding, Cost of goods sold, Net promoter score, Customer retention rate, % Sales lost to active customers.
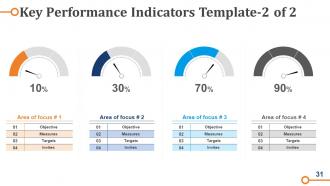
Slide 31: This slide also presents Key Performance Indicators in dashboard imagery.
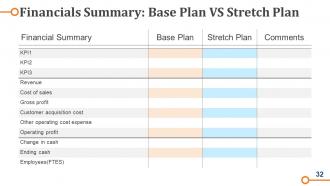
Slide 32: This slide shows Financials Summary: Base Plan VS Stretch Plan.
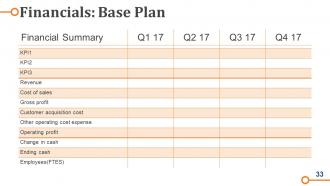
Slide 33: This slide displays Financials: Base Plan table.
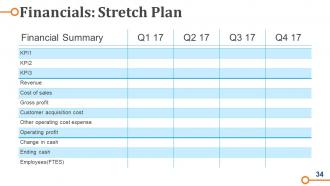
Slide 34: This slide displays Financials: Stretch Plan table.
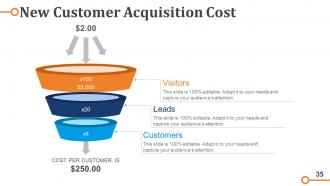
Slide 35: This slide shows New Customer Acquisition Cost Visitors, Leads, Customers.
Slide 36: This slide presents Customer Lifetime Value (CLV) divided into- Inactive Nonprofit Able, Active Profitable Customers, Very Active Very Profitable Customers.
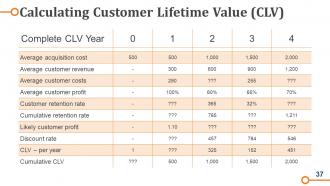
Slide 37: This slide shows a Calculating Customer Lifetime Value (CLV) table for calculations.
Slide 38: This sldie showcases an Operating Plan.
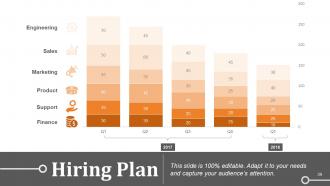
Slide 39: This slide shows a Hiring Plan with the folowing factors- Engineering, Sales, Marketing, Product, Support, Finance.
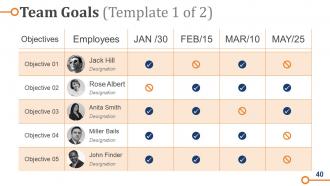
Slide 40: This slide shows Team Goals with Objectives and employees name.
Slide 41: This slide shows Team Goals with Objectives and team name.
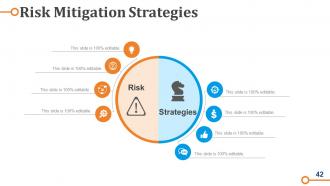
Slide 42: This slide shows Risk Mitigation Strategies involved.
Slide 43: This slide presents Icons For Business Operations Strategy Model. Use them as per your requirement.
Slide 44: This slide is titled Additional Slides for moving forward.
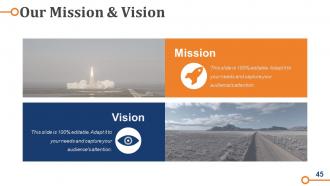
Slide 45: This is Our Mission & Vision slide with imagery and text boxes.
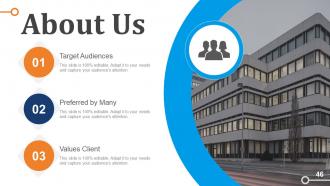
Slide 46: This is an About Us slide with target audience, prefefredby many and Values client as examples.
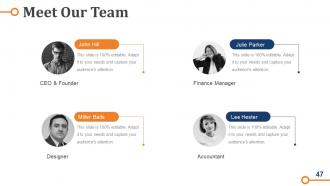
Slide 47: This is a Meet Our Team slide to put names and designation.
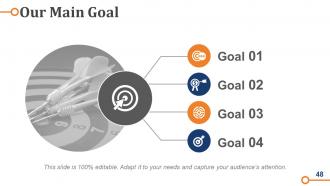
Slide 48: This is Our Main Goal slide. State your main goals here.
Slide 49: This is a Comparison slide to compare products, entities etc.
Slide 50: This is an Our Target slide to state targets, goals etc.
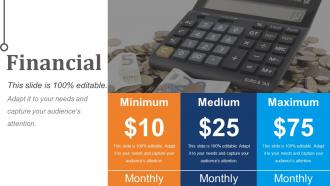
Slide 51: This is Financial score slide. State financial aspects, factors etc . here.
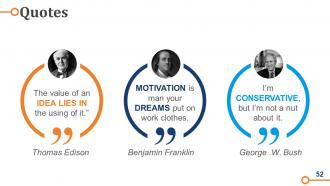
Slide 52: This is a Quotes slide to convey message, beliefs etc.
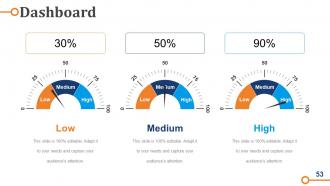
Slide 53: This is a Dashboard slide to show High, Low and Medium.
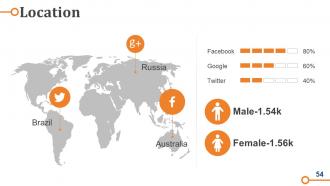
Slide 54: This is a Location slide for showing global growth, presence on a world map.
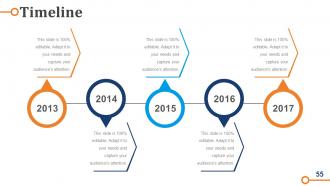
Slide 55: This is a Timeline slide to show milestones, growth highlights etc.
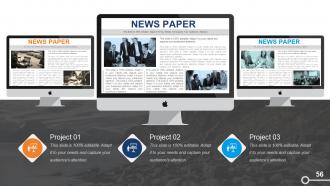
Slide 56: This is a News Paper slide to show company events etc. You can change it as per requirement.
Slide 57: This is a Venn diagram slide to show information, specifications etc.
Slide 58: This is a Lego slide to show information, specifications etc.
Slide 59: This is a Silhouettes slide to show people related information, specifications etc.
Slide 60: This is an Important Notes slide to mark reminders, information, specifications etc.
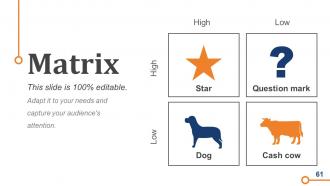
Slide 61: This is a Matrix slide to show specific factors etc.
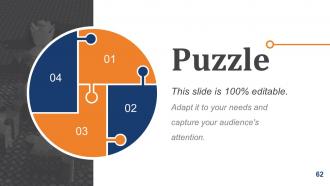
Slide 62: This is a Puzzle image slide to show information, specifications etc.
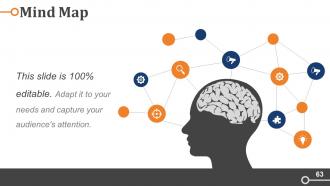
Slide 63: This is a Mind Map image slide to show information, specifications etc.
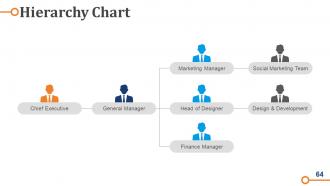
Slide 64: This is a Hierarchy chart slide to showcase team information, specifications etc.
Slide 65: This is a Magnifying glass image slide to show information, specifications etc.
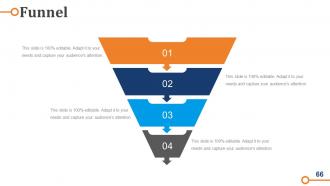
Slide 66: This is a Funnel image slide to show information, specifications etc. in a funnel form.
Slide 67: This slide is titled Our Charts & Graphs to proceed forward.
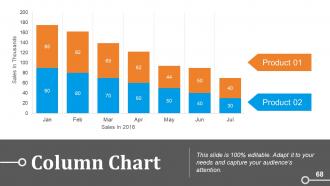
Slide 68: This is a Column Chart to show product/entity growth, comparison.
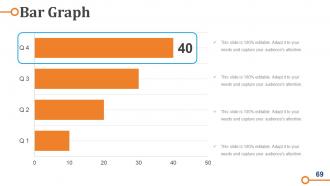
Slide 69: This is a Bar Graph slide to show product/entity growth, comparison.
Slide 70: This is a Line Chart slide to show product/entity growth, comparison.
Slide 71: This is a Scatter Chart slide to show product/entity growth,comparison etc.
Slide 72: This is an Area Chart slide to show product/entity growth, comparison.
Slide 73: This is a Radar Chart slide to show product/entity growth, comparison.
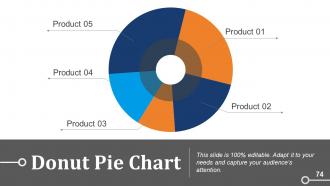
Slide 74: This is a Donut Pie chart slide to show product/entity growth, comparison.
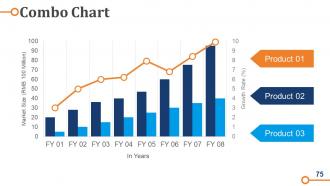
Slide 75: This is a Combo Chart slide to show product/entity growth, comparison.
Slide 76: This is a Thank You slide with Address# street number, city, state, Contact Numbers, Email Address.
Business Operations Strategy Model Powerpoint Presentation Slides with all 76 slides:
Cover the deficit with our Business Operations Strategy Model Powerpoint Presentation Slides. They excel at bridging gaps.
-
Business Operations Strategy Model
-
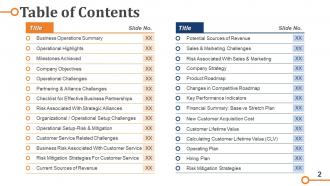
Table of Contents
-
Our Agenda
-
Business Operations Summary
-
Operational Highlights FY18
-
Milestones Achieved Option 1of 2
-
Milestones Achieved Option 2of 2
-
Company Objectives
-
Operational Challenges
-
Partnering Alliances Execution Stages
-
Checklist Effective Business Partnerships
-
Business Risk Associated With Customer Service
-
Organizational Operational Setup Challenges
-
Operational Setup Risk Mitigation
-
Customer Service Related Challenges
-
Business Risk Associated With Customer Service
-
Risk Mitigation Strategies for Customer Service
-
Current Sources of Revenue
-

Coffee Break
-
Potential Sources of Revenue
-
Sales Marketing Challenges
-
Risk Associated With Sales Marketing
-
Company Strategy
-
Product Roadmap Product Launch Deliverables 1
-
Product Roadmap Product Launch Deliverables 2
-
Product Roadmap Product Launch Deliverables
-
Product Roadmap
-
Changes In Competitive Environment
-
Changes In Competitive Environment
-
Key Performance Indicators Template 1 of 2
-
Key Performance Indicators Template 2 of 2
-
Financials Summary Base Plan VS Stretch Plan
-
Financials Base Plan
-
Financials Stretch Plan
-
New Customer Acquisition Cost
-

Customer Lifetime Value CLV
-
Calculating Customer Lifetime Value CLV
-

Operating Plan
-
Hiring Plan
-
Team Goals Template 1 of 2
-

Team Goals Template 2 of 2
-
Risk Mitigation Strategies
-
Icons for Business Operations Strategy Model
-
Additional Slides
-
Our Mission Vision
-
About Us
-
Meet Our Team
-
Our Main Goal
-

Comparison
-
Our Target
-
Financial
-
Quotes
-
Dashboard
-
Location
-
Timeline
-
News Paper
-
Venn
-
Lego
-
Silhouettes
-
Important Notes
-
Matrix
-
Puzzle
-
Mind Map
-
Hierarchy Chart
-
Magnifying Glass
-
Funnel
-

Our Charts Graphs
-
Column Chart
-
Bar Graph
-
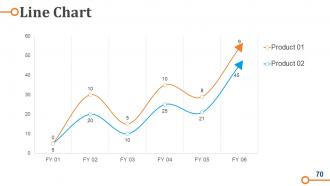
Line Chart
-
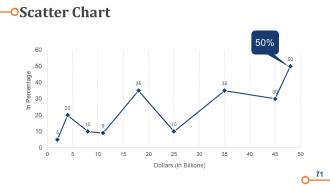
Scatter Chart
-
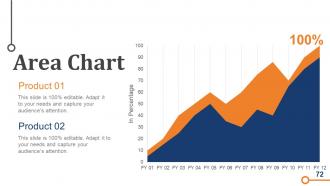
Area Chart
-
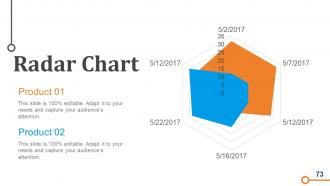
Radar Chart
-
Donut Pie Chart
-
Combo Chart
-
Thank You
FAQs for Business Operations Strategy Model
You've got four main things to nail down: process optimization, resource allocation, tech integration, and performance measurement. Map out your current processes first - can't fix what you can't see, right? Then look at where you're putting people and money. Tech-wise, pick tools that actually solve problems instead of just looking cool (learned that one the hard way). Quality control and supply chain stuff matter tons depending on your business. The real trick? Getting all these pieces to work together instead of everyone doing their own thing. Oh, and definitely track whether it's all working - otherwise you're just guessing.
Start with the boring stuff nobody wants to do - payroll, invoicing, all that data entry nonsense. It's honestly a game changer once you automate it. Get cloud tools that actually talk to each other (your CRM should connect to accounting software, for example). Project management platforms are clutch for keeping everyone on the same page. Oh, and analytics will show you where things are breaking down that you probably didn't even notice. Don't go crazy trying to fix everything though. Pick your biggest headache first and solve that one problem. You'll save your sanity.
Honestly, data analytics is like having x-ray vision for your business. You'll catch bottlenecks and waste that you'd totally miss otherwise. Track your workflows for a month and watch the patterns emerge – I'm telling you, companies regularly cut costs by 20-30% this way. The best part? You can actually predict problems before they blow up. My buddy's company started with just analyzing their production line (nothing fancy) and found three massive time drains they never knew existed. Pick one process that bugs you and start tracking those numbers. You won't believe what shows up.
Look, you gotta figure out what your customers actually give a damn about vs. what's just internal fluff. Map out which quality stuff directly hits customer satisfaction - then cut from the waste and inefficient crap, not the things that matter to buyers. I've watched too many companies gut the wrong areas and tank their reputation. Test small changes first, see how customers react. Don't go slashing materials or key steps that affect your end product. Oh, and make sure your savings aren't gonna bite you later - sometimes "cheaper" costs way more down the road.
Honestly, the hardest part is getting people to actually change what they're doing. Your team will push back because they're used to the old way - even when it sucks. Then you've got departments that don't talk to each other, so good luck getting everyone aligned. Resources are always tight, communication gets muddy, and half the time you can't even tell if it's working because nobody set up proper metrics. Oh, and if leadership isn't really behind it? Forget about it. Start with something small first - prove it works, then expand from there.
Honestly, most ops teams don't even know what their company's actual strategy is - which is wild but happens all the time. Start there first. Once you've got that figured out, align your operational stuff directly with those goals. Growing fast? Focus on scaling up and building capacity. Trying to boost profits? Then efficiency and cutting costs become your main thing. Here's what really works: make sure your ops metrics match up with the corporate KPIs. They should basically be telling the same story about success. Also, set up regular check-ins between the ops and strategy people so you don't drift apart when priorities change.
Track both how fast things move and how well they actually work. Cycle time, throughput, cost per unit, quality scores - the usual suspects for operations. But honestly? Customer satisfaction and on-time delivery matter way more than fancy numbers that just look impressive in meetings. Employee productivity's huge too since miserable workers tank everything else. ROI and cost savings prove you're not just shuffling deck chairs around. Stick to maybe 5-7 metrics tops and check them monthly. More than that and you'll drive yourself crazy trying to optimize everything at once.
External factors mess with your operations planning constantly - it's like trying to drive when the road keeps shifting under you. Budget constraints change when the economy tanks. Supplier costs jump around. Customer demand goes totally sideways sometimes. You'll need to stay flexible instead of locking into some rigid master plan. Market trends are honestly the worst because they can kill your processes overnight (AI's doing that to everyone right now). Best approach? Monitor key indicators regularly and always have backup scenarios ready. That way you can actually pivot fast when - not if - things change.
Look, your strategy means nothing if your people can't actually pull it off. I've watched brilliant plans crash and burn because nobody bothered teaching teams the new processes. People end up confused about priorities, making expensive mistakes, or just sticking to old ways that don't work anymore. Training fills that gap between where you are and where you need to be. When people understand their piece of the puzzle AND have the right skills? That's when things click. Plus they'll actually buy into changes when they feel capable of succeeding. Honestly, most strategy failures come down to execution problems that good training could've prevented.
Look, the secret is getting everyone involved, not just the higher-ups. People see problems every day but won't speak up if they think they'll get blamed for it. So create a safe space - maybe weekly check-ins or even just a suggestion box that you actually use. When someone has a good idea, run with it! And honestly? Celebrate the tiny wins too. I learned this the hard way - perfectionism kills innovation. Try one small experiment monthly and track results together. People need to see their input matters, or they'll just stop trying.
Dude, first thing - map out your whole supply chain so you actually know where things get stuck. Real-time inventory tracking is a game changer. Build solid relationships with your suppliers too, like treat them as partners instead of just people you pay. Honestly the best suppliers I've worked with felt more like teammates. Get some decent software that handles ordering automatically and predicts what you'll need. Oh and don't put all your eggs in one basket - diversify your supplier base because when one fails, you're toast. Do regular check-ins and tweak contracts based on real data, not hunches.
Okay so service businesses are weird because your "product" is basically just the experience people get. You can't store services or let customers return them if they suck - everything has to work perfectly in the moment. Product companies worry about manufacturing and supply chains, but you're dealing with way more unpredictable demand swings. Quality control is honestly a nightmare since you can't test anything beforehand. The trick is standardizing your processes enough to be consistent, but leaving room for that personal touch customers actually want. Oh, and your employees matter way more than in other industries since they ARE the product.
Look, stakeholder feedback is honestly like having a GPS for your operations - without it you're just guessing. Customers will tell you what's broken, employees know where processes suck, and suppliers see bottlenecks you don't. I've watched companies make huge strategy changes without asking anyone and then act shocked when it fails miserably. You need regular check-ins - surveys, team meetings, focus groups, whatever works. Pick your top 5 stakeholder groups and set up quarterly touchpoints with them. Trust me, it beats making decisions in the dark.
So agile basically breaks everything into these short 1-4 week sprints instead of those massive long-term plans that always fall apart anyway. Your team can actually pivot when stuff changes - and trust me, stuff always changes. You're doing regular check-ins so problems get caught early rather than becoming disasters later. The feedback loops keep everyone on the same page, which is huge. Cross-functional teams help too since there's less waiting around for handoffs when urgent things pop up. I'd honestly just try it with one team first - see how it goes before doing the whole company thing.
Build risk planning into your strategy from the start - don't just tack it on later. Map out what could go wrong operationally: supply chain mess-ups, tech crashes, people quitting. Then actually plan for each scenario. I swear, most teams get so pumped about growth numbers they totally skip the "what if everything breaks" part. Make someone own each risk area so it doesn't just disappear into the void. Bake risk check-ins into quarterly reviews. Honestly? Start small - pick your 5 biggest vulnerabilities and draft response plans this week.
-
Design layout is very impressive.
-
Use of different colors is good. It's simple and attractive.