


Business review powerpoint presentation slides





Try Before you Buy Download Free Sample Product
 Impress Your
 Audience
 100%
100% Editable
 Save Hours
 of Time


Set up recurring meetings that can be held to discuss the company's progress and objectives by using this business review PowerPoint presentation slides. This content ready financial performance PowerPoint deck is completely editable. You can make changes as per your requirements in terms of color, fonts, diagrams and text. This business overview PPT deck is available to download immediately. During the business review meeting, teams apply problem-solving tools to issues impacting their performance. This business performance analysis PPT theme can be used to see how finances are used and how well the company is doing in each region. Show other important slides like quarterly business review, highlights, financial summary, revenue split, key milestones achieved, balance sheet, cash flow statement, key financial ratios, funding updates, etc. You can also use this financial analysis PowerPoint slides to show your top vendors and top clients and their financial status. Download this amazing visually strong financial overview PPT deck now. Bridge any generation gap with our business review presentation. Get folks of all ages to bond.
People who downloaded this PowerPoint presentation also viewed the following :
Content of this Powerpoint Presentation
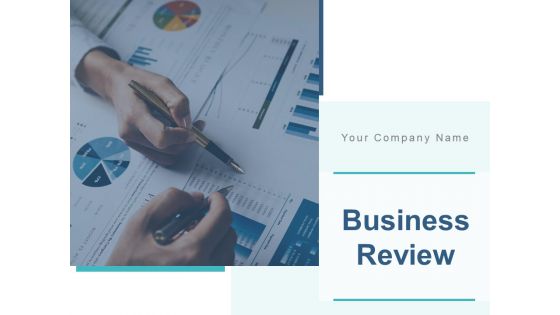
Slide 1: This slide introduces Business Review. State Your Company Name and begin.
Slide 2: This is an Agenda slide. State your agendas here.
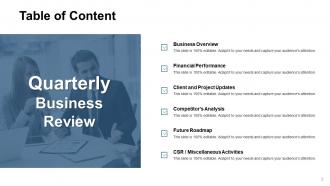
Slide 3: This slide shows Table of Content for the presentation.
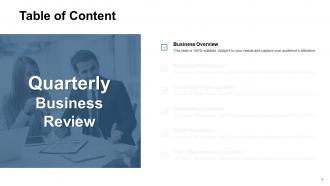
Slide 4: This slide highlights Business Overview from Table of Content.
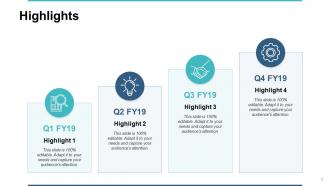
Slide 5: This slide displays Highlights with related icons and additional text boxes.
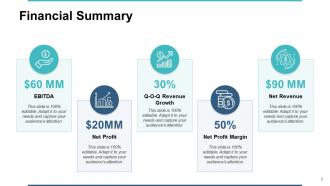
Slide 6: This slide presents Financial Summary describing- EBITDA, Net Profit, Q-O-Q Revenue Growth, Net Profit Margin, Net Revenue.
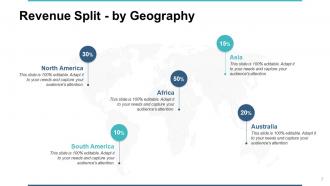
Slide 7: This slide showcases Revenue Split - by Geography showing data in percentage.
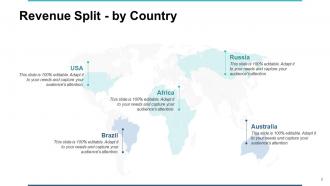
Slide 8: This slide represents Revenue Split - by Country including countries as- Asia, Australia, South America, North America, Africa.
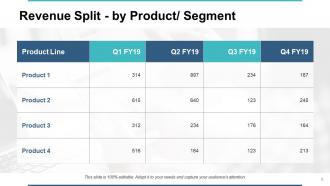
Slide 9: This slide shows Revenue Split - by Product/ Segment in tabular form.
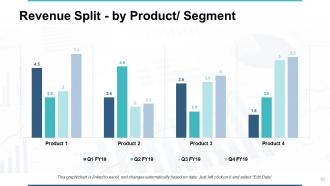
Slide 10: This slide presents Revenue Split - by Product/ Segment in graphical form.
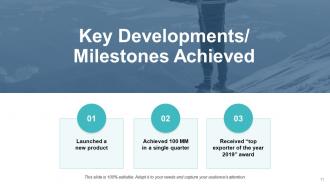
Slide 11: This slide displays Key Developments/ Milestones Achieved with related imagery.
Slide 12: This slide highlights Financial Performance from Table of Content.
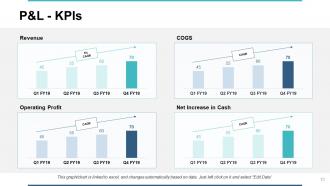
Slide 13: This slide represents P&L - KPIs describing- Revenue, COGS, Operating Profit, Net Increase in Cash.
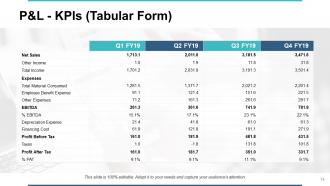
Slide 14: This slide showcases P&L - KPIs (Tabular Form).
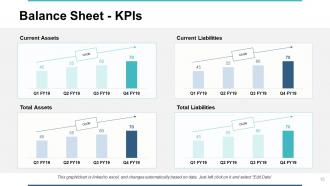
Slide 15: This slide shows Balance Sheet - KPIs describing- Current Assets, Current Liabilities, Total Assets, Total Liabilities.
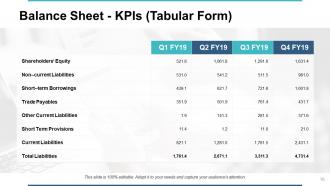
Slide 16: This slide presents Balance Sheet - KPIs (Tabular Form) showing liabilities.
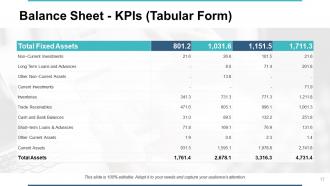
Slide 17: This slide displays Balance Sheet - KPIs (Tabular Form) showing assests.
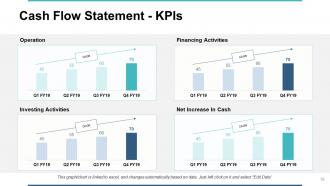
Slide 18: This slide represents Cash Flow Statement - KPIs describing- Operation, Financing Activities, Investing Activities, Net Increase In Cash.
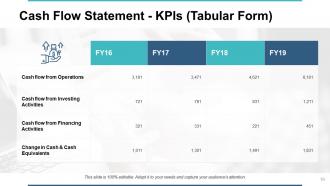
Slide 19: This slide showcases Cash Flow Statement - KPIs (Tabular Form).
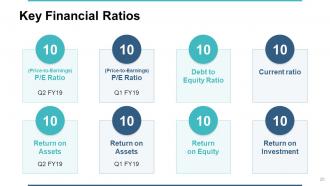
Slide 20: This slide shows Key Financial Ratios including- P/E Ratio, Debt to Equity Ratio, Current ratio, Return on Assets, Return on Equity, Return on Investment.
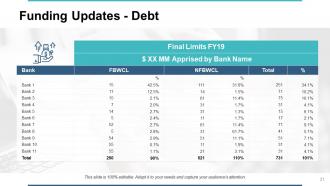
Slide 21: This slide presents Funding Updates showing Debts.
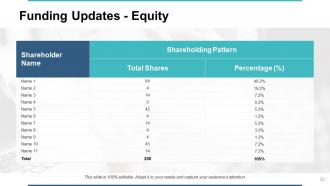
Slide 22: This slide presents Funding Updates showing Equity.
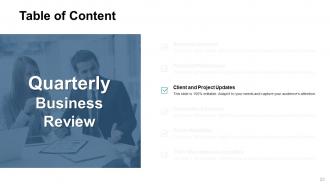
Slide 23: This slide highlights Client and Project Updates from Table of Content.
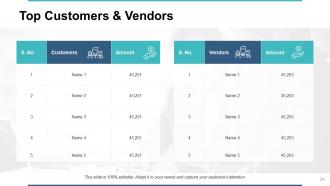
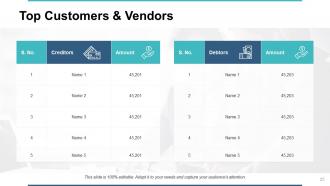
Slide 24: This slide displays Top Customers & Vendors in tabular form.
Slide 25: This slide represents Top Customers & Vendors with creditors and debtors.
Slide 26: This slide showcases Client Updates with related images.
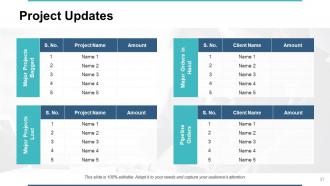
Slide 27: This slide shows Project Updates on major projects bagged, major orders in hand, major projects lost and pipeline orders.
Slide 28: This slide highlights Competitor's Analysis from Table of Content.
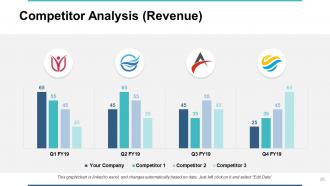
Slide 29: This slide shows Competitor Analysis (Revenue) with the help of bar graph.
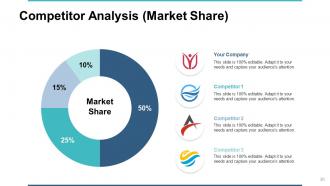
Slide 30: This slide presents Competitor Analysis (Market Share) with the help of Pie Chart.
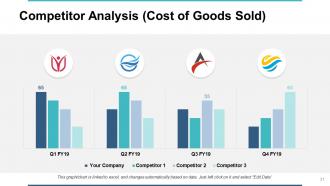
Slide 31: This slide displays Competitor Analysis (Cost of Goods Sold).
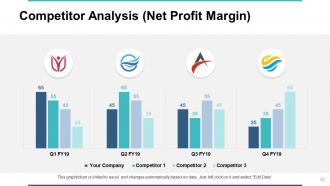
Slide 32: This slide represents Competitor Analysis (Net Profit Margin).
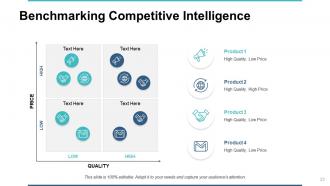
Slide 33: This slide showcases Benchmarking Competitive Intelligence in matrix form.
Slide 34: This slide highlights Future Roadmap from Table of Content.
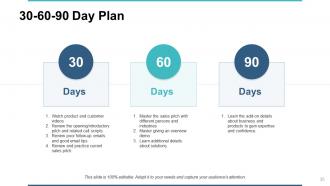
Slide 35: This slide shows 30-60-90 Day Plan with text boxes.
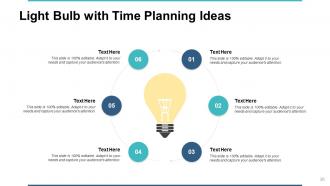
Slide 36: This slide presents Light Bulb with Time Planning Ideas.
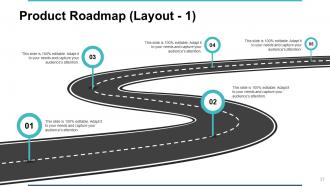
Slide 37: This slide displays Product Roadmap (Layout - 1) in timeline form.
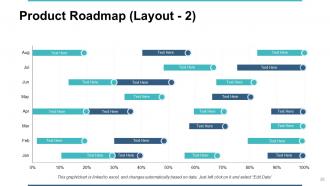
Slide 38: This slide represents Product Roadmap (Layout - 2) in graphical form.
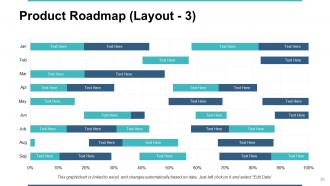
Slide 39: This slide showcases Product Roadmap (Layout - 3).
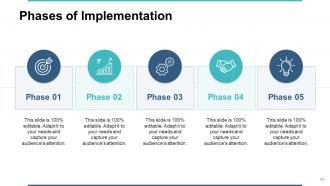
Slide 40: This slide shows Phases of Implementation with text boxes.
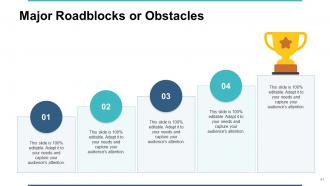
Slide 41: This slide presents Major Roadblocks or Obstacles.
Slide 42: This is an optional slide for Major Roadblocks or Obstacles.
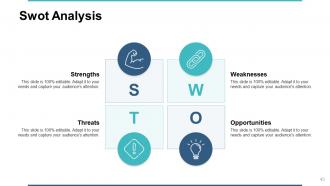
Slide 43: This slide displays Swot Analysis. Describe your firm's Strengths, weaknesses, opportunities and threats.
Slide 44: This slide highlights CSR / Miscellaneous Activities from Table of Content.
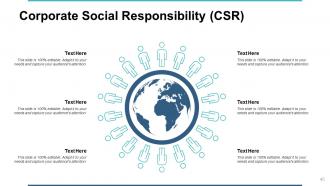
Slide 45: This slide represents Corporate Social Responsibility (CSR) with related diagram and text boxes.
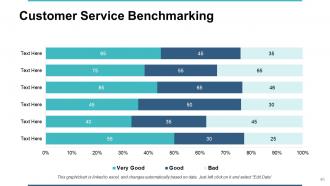
Slide 46: This slide showcases Customer Service Benchmarking in graphical form.
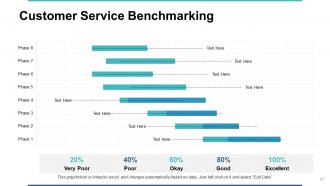
Slide 47: This is an optional slide for Customer Service Benchmarking.
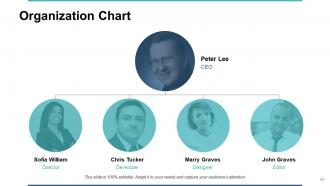
Slide 48: This slide shows Organization Chart with names and designation.
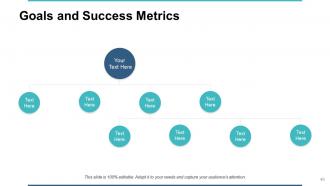
Slide 49: This slide presents Goals and Success Metrics. Add data as per needs.
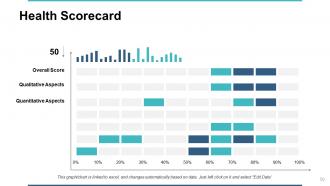
Slide 50: This slide displays Health Scorecard with Overall Score, Qualitative Aspects, Quantitative Aspects.
Slide 51: This slide displays Business Review Icons.
Slide 52: This slide reminds about a Coffee Break.
Slide 53: This slide is titled as Additional Slides for moving forward.
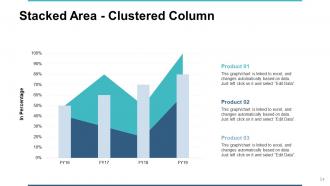
Slide 54: This slide shows Stacked Area - Clustered Column chart with three products comparison.
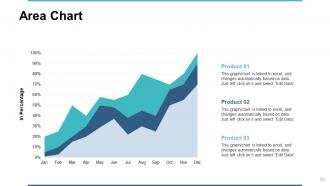
Slide 55: This slide presents Area Chart with three products comparison.
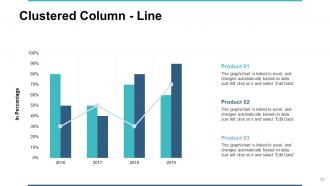
Slide 56: This slide displays Clustered Column - Line chart for product comparison.
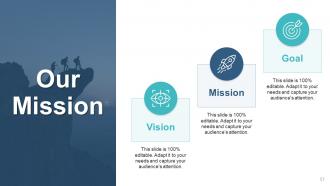
Slide 57: This is Our Mission slide with related imagery and text.
Slide 58: This is About Us slide to show company specifications etc.
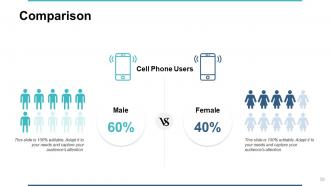
Slide 59: This is a Comparison slide to state comparison between commodities, entities etc.
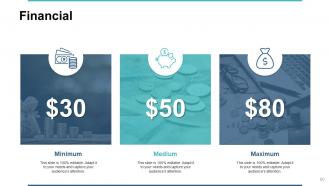
Slide 60: This is a Financial slide. Show your finance related stuff here.
Slide 61: This is a Target slide. State your targets here.
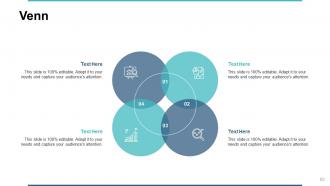
Slide 62: This is a Venn slide with text boxes.
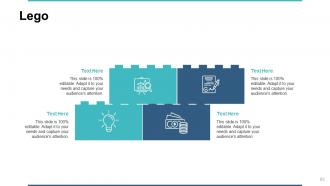
Slide 63: This is a Lego slide with additional text boxes to show information.
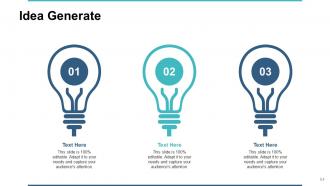
Slide 64: This is an Idea Generation slide to state a new idea or highlight information, specifications etc.
Slide 65: This is a Thank You slide with address, contact numbers and email address.
Business review powerpoint presentation slides with all 65 slides:
Use our Business Review Powerpoint Presentation Slides to effectively help you save your valuable time. They are readymade to fit into any presentation structure.


FAQs for Business review
So revenue growth and profit margins are obvious ones to watch. Customer acquisition costs too - that's where a lot of companies mess up without realizing it. Cash flow though? That's the big one everyone overlooks until it's too late. I've literally watched profitable businesses go under because they ignored this. Also track customer retention and employee turnover since those directly hit your bottom line. Oh, and whatever KPIs matter for your specific industry. But honestly? Don't try tracking like 20 different things. Pick maybe 5-7 that actually matter and focus on those instead of spreading yourself thin.
Dude, templates are a game changer for business reviews. They keep you from rebuilding the same slides every damn quarter - which honestly feels like groundhog day after a while. Your team knows exactly where to look for the important stuff. Structure stays consistent so comparing data across quarters actually makes sense instead of being a hot mess. I'd start basic: core KPIs, financials, action items. Visual consistency helps too. Then just tweak it when people keep asking the same questions you forgot to include.
Biggest mistake? Trying to analyze everything instead of just the stuff that matters for decisions. You'll go down random rabbit holes for hours. I've watched so many of these turn into blame games too - totally useless. Don't just look at the numbers either, you need context to figure out WHY things happened. Oh, and start getting feedback from people early. Seriously. If you wait till the end, you're scrambling to make sense of everyone's input and your recommendations end up being garbage.
Honestly, I'd go with quarterly deep dives and monthly quick check-ins. Yeah, I know you're already buried, but the market's moving too fast to wait a whole year between reviews. Those quarterly ones should hit your financials, competition, customer stuff, and how things are running day-to-day. Monthly ones can be super quick - just key numbers and anything that looks sketchy. I learned this the hard way after missing some warning signs last year. The trick is catching problems early without spending all your time analyzing instead of actually doing the work.
Dude, you absolutely need employee feedback for any real business review. Your team spots the daily problems and bottlenecks that management totally misses. They're doing the actual work, so they know what's broken versus what just looks pretty in reports. Getting their input also makes people feel heard - which honestly matters more than most bosses realize. Set up anonymous feedback first (people are way more honest that way) and ask specific stuff about their processes and what's slowing them down. Without their perspective you're just guessing at solutions.
Dude, you've gotta start using charts and graphs in your presentations. Nobody wants to stare at endless spreadsheet rows - it's like torture. When you show data visually, people actually get it right away. They can spot trends and problems without squinting at numbers for five minutes. I learned this the hard way after watching executives' eyes glaze over during my first few reviews. Visuals keep everyone awake too, which is honestly half the battle. Just start with basic bar charts or line graphs. You'll be shocked how much better your meetings go when people can actually see what you're talking about.
Tell the story behind your data, don't just throw numbers at people. Lead with your main points - did you crush it or fall short? Charts work way better than endless spreadsheet rows (seriously, nobody reads those). Compare against something that actually matters like last year or your budget. Yeah, be upfront about what went wrong, but have a plan ready. Oh and practice beforehand! You'll sound way more confident talking through the numbers instead of just reading off slides. Trust me, it makes a huge difference when you can actually speak to your data.
Honestly, ditch those cookie-cutter review templates everyone uses. Figure out what actually drives success in your specific industry first. Retail? Customer experience and how well you manage inventory matter way more than generic BS. Tech companies should be looking at innovation metrics and dev cycles. Healthcare has to nail compliance and patient outcomes - that's non-negotiable. Manufacturing is all about safety and efficiency numbers. Here's what I'd do: check what your biggest competitors are measuring, then see what regulators in your space actually care about. Build your reviews around those critical factors instead of some one-size-fits-all approach that doesn't mean anything.
Honestly, start with Tableau or Power BI for visualizing your data - makes everything way clearer. Google Analytics and HubSpot are great for tracking how things are actually performing. I'd throw in Asana or Monday.com too since they show you what's getting done vs what you *think* is getting done. Slack works well for collecting team feedback, though sometimes people just ignore messages anyway. Here's the thing though - don't go crazy with tools. Pick like 2-3 max and stick with them. I've seen too many businesses try to use everything at once and end up using nothing properly. Whatever plays nice with your current setup is probably your best bet.
Honestly, just treat customer feedback like you would your revenue data - build it right into your quarterly reviews. I always throw real customer quotes into presentations because they pack way more punch than boring charts. Track the themes over time too, not just those snapshot scores everyone obsesses over. When the same complaints keep popping up? Turn those into actual action items. Oh, and here's what works really well - spotlight 2-3 specific customer voices each review and connect their feedback directly to whatever strategic moves you're planning. Makes the whole thing feel less abstract, you know?
Honestly, the trick is making people feel heard instead of just going through the motions. Send materials 48 hours early so they can actually think beforehand - nobody wants to just sit there nodding. Different groups care about different stuff, so tailor your questions. Finance won't have the same concerns as operations, you know? Don't just ask "any questions?" to a silent room either. Call people out directly. Here's the big thing though - follow up with concrete next steps that mention their input. People check out fast when they realize their feedback goes nowhere. Show them it matters and they'll keep engaging.
Okay so first thing - grab your baseline numbers from that original review. Revenue, customer satisfaction, whatever you were actually trying to fix. Then track the exact same stuff after you make changes. Give it at least 3 months to see real patterns, though honestly some things pop up way sooner. Don't be tempted to only look at the wins - I've definitely been guilty of that before. Monthly check-ins work well, just set a phone reminder or you'll totally forget. The whole point is figuring out what's actually moving vs what just looks good on paper. Course-correct fast if something's clearly not working.
Honestly, most companies are setting up automated alerts now to catch reviews the second they drop - Google, Yelp, all those industry sites. AI sentiment analysis is pretty clutch for spotting problems early. Skip those cringe "thanks for your feedback" templates though. People can smell generic responses from a mile away. Some businesses are even doing video responses for bigger complaints, which is kinda smart actually. The real game-changer? Don't just wait around hoping for reviews. Hit up customers after they buy something and ask. Start by figuring out where your reviews actually live, then automate the monitoring part first.
Think of your business review as basically a health checkup before you start planning anything big. It shows you what's working, what's broken, and what opportunities you're probably missing. Most companies totally skip this step and wonder why their plans fall flat. Pull your last quarter's numbers first - they'll tell you the real story. Then use that as your starting point for setting goals that actually make sense. Short sentences work here. You can't allocate resources properly if you don't know where you currently stand, right? Start there and build forward.
Look at their pricing first - how does it stack up against yours? Then check what features they're pushing that you don't have (and what you've got that they're missing). Their positioning matters too - like, what's their main pitch to customers? I'd also peek at their website and customer support flow. Pretty telling stuff there. Marketing-wise, see where they're active - social, ads, whatever. Don't go crazy though, maybe stick to 3-4 competitors or you'll be there all day analyzing every little thing. The whole point is spotting opportunities or figuring out where you need to step up your game fast.
-
Best way of representation of the topic.
-
Appreciate the research and its presentable format.
-
good