


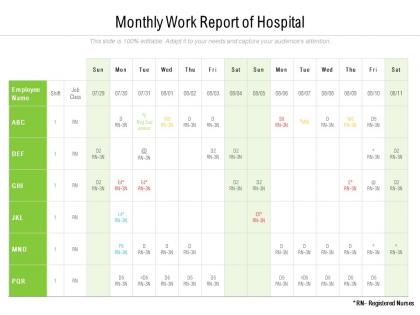
Monthly work report of hospital




Try Before you Buy Download Free Sample Product
 Impress Your
 Audience
 100%
100% Editable
 Save Hours
 of Time


Enable folks to invest intelligently with our Monthly Work Report Of Hospital. Inform them of avenues to ensure high interest.
People who downloaded this PowerPoint presentation also viewed the following :
Monthly work report of hospital with all 2 slides:
Highlight good investments with our Monthly Work Report Of Hospital. Enable folks to generate higher incomes.
FAQs for Monthly work
Okay so focus on four main areas: patient stuff, operations, money, and staffing. Track patient satisfaction, readmission rates, length of stay - the usual suspects. Bed occupancy and ER wait times are huge for ops. Revenue per patient and cost per case will keep finance happy (trust me on this one). Don't sleep on staff turnover and overtime hours because when those get messy, everything else falls apart. Oh and surgical volumes if that applies to your unit. Honestly? Stick to like 10-12 metrics total. Any more and executives just zone out during presentations.
HCAHPS surveys are your baseline for consistency, but throw in some custom questions that actually matter to your patients. Get those surveys out within 48 hours while everything's still fresh in their minds - email usually does the trick. Response rates are honestly pretty terrible most of the time, so maybe do phone calls for your more serious cases. Track the usual stuff like overall satisfaction and whether they'd recommend you. Here's the thing though - segment everything by department in your monthly reports or you'll miss the real problem spots. Data's useless unless department heads can actually do something with it.
Okay so your monthly hospital report basically lives or dies by the financial analysis part. Track your revenue per department, operating margins, patient volumes, and cost per case - that's where the real story is. Honestly, some departments will surprise you with how much money they're actually losing. Look at month-over-month AND year-over-year data because seasonal stuff can really mess with your head if you're not careful. The whole point is catching which services are making bank versus which ones are draining your budget. Oh, and don't forget to compare against your targets - that's usually where the uncomfortable conversations start.
Look, readmission data shows you exactly where things are breaking down in your system. High rates in certain departments? Your discharge planning probably sucks there. I'd track it month-over-month to see what's actually moving the needle. You can use those numbers to get budget approval for more discharge coordinators or better patient education - administrators love data that justifies spending. Some docs might need help with their follow-up protocols too. Don't stress about the metric itself though. Focus on the trends and what they're telling you about where to put your resources.
Honestly, just keep it simple - clear charts that actually tell a story. Start with KPI scorecards at the top, then use line graphs for trends like patient volume over time. Bar charts are perfect for comparing departments or satisfaction scores. Don't jam everything on one page though, execs get overwhelmed fast. I always use consistent colors (red for problems, green for good stuff) and throw in last month's data for comparison. Oh, and put your biggest wins and disasters right up front where they'll actually look. Less really is more here.
You're spot on asking about staffing - it's like the domino that knocks everything else over. Patient satisfaction tanks when nurses are running around crazy busy. Readmissions shoot up because nobody has time for proper discharge planning. Wait times get ridiculous. I've literally seen 10% short-staffed units have 15% longer patient stays, which is wild. Your financial numbers get messy too since you're paying overtime but probably losing patient volume. Honestly, whenever I'm looking at weird monthly trends, staffing issues are usually what's actually causing the chaos behind all those other metrics.
Monthly reports are honestly goldmines for this stuff. Look at your patient flow first - where are the bottlenecks happening? Which departments are burning through supplies like crazy? I always check wait times since those kill everything downstream. Track your readmission rates and bed turnover month to month too. Staff productivity patterns jump out when you actually see the numbers laid out. It's wild how much becomes obvious once it's all there in black and white. Pick your worst three problem areas and focus there next quarter instead of trying to fix everything at once.
Honestly, start with the big ones - patient satisfaction scores and 30-day readmission rates. Those really tell the story. Track your average length of stay too, month over month comparisons work best. Infection rates are critical, especially the hospital-acquired stuff that kills your scores. Don't forget medication errors, patient falls, and how fast you're responding to call buttons. Pain management scores matter more than people think. Oh, and discharge planning effectiveness - that one's sneaky important. Charts and graphs are your friend here, makes it way easier for leadership to see trends at a glance.
Ok so basically you need separate sections for each regulation - HIPAA, CMS, Joint Commission, all that fun stuff. Don't just say "we're compliant" though, that's useless. Get actual numbers: how many staff finished training, incident reports filed, what you fixed when things went wrong. Audit trails are huge too. I know it sounds tedious but honestly? Inspectors eat this stuff up. Track the good (protocols followed) and the bad (violations, close calls). My old manager used to say documentation without dates is just creative writing lol. Bottom line - prove it with real data, don't just claim it.
Honestly, I'd start with getting everyone on the same page with data entry - same definitions, same coding standards, you know? Set up automated validation rules to catch the obvious mistakes early because fixing stuff later is such a pain. Weekly spot-checks work way better than scrambling at month-end to find problems. Oh, and definitely train your staff properly on the new processes - seems obvious but people skip this step all the time. I'd probably test everything with just one department first before going hospital-wide. Way less chaotic that way.
Just tailor the content differently for each group. Board members want the big financial numbers, quality metrics, and strategic updates - basically the stuff they can make decisions on. Your staff needs the nitty-gritty operational details like staffing numbers, patient satisfaction, and how their specific departments are doing. I swear, generic reports are the worst because nobody gets what they actually need. Why would board members care about every little supply issue? And frontline staff don't need to see detailed budget breakdowns. Create different sections - executive summaries, detailed operational stuff - then just pick what works for each audience.
Ugh, data silos are the worst part honestly. Different departments all use their own systems that never sync up, so you're stuck doing everything manually. Clinical staff? Forget getting timely submissions from them - they're drowning in patient care. Financial data comes from one place, quality measures from another... it's a mess. Oh, and don't even get me started on version control issues when everyone's working off different spreadsheets. Start your template early though, like beginning of the month. Set those automated reminders for department heads at least a week out or you'll be chasing people down last minute.
Honestly, automation is where it's at for cutting down reporting time. Your EMR and billing systems can feed data directly into reporting software instead of you manually pulling numbers from everywhere. Real-time updates are clutch for those monthly deadlines - no more scrambling at the last minute. Plus you'll have way fewer errors without all that manual entry. Oh, and definitely start with tools that play nice with what you're already using. Nobody has time to rebuild their entire system from scratch, you know? The standardized templates alone will save you hours.
Honestly, looking at just one month's data is like trying to judge a movie from a single scene. When you compare several months, you can actually see what's happening - is that patient satisfaction drop a real trend or just a weird fluke? Same with staffing improvements and how your new programs are actually working out. The sneaky part is those gradual shifts that happen so slowly you miss them otherwise, like readmission rates creeping up or efficiency slowly tanking. Healthcare numbers bounce around a lot month-to-month anyway, so you've gotta focus on the bigger patterns instead of freaking out over every little dip.
Just document everything in the "Service Updates" section - new stuff you're launching, things you're cutting, whatever changes. Include the date it kicks in and why you made the call. Honestly, I used to totally blank on this until the very end and it always bit me later. Revenue impacts matter too, so jot those down. Your department heads should give you a heads up when changes happen, but let's be real - they forget half the time. I'd make a simple tracking sheet or you'll be scrambling trying to remember what actually changed when report time rolls around. Way easier than playing detective later.
No Reviews