

Overlapping circles showing three set venn connections





Try Before you Buy Download Free Sample Product
 Impress Your
Audience
 100%
Editable
 Save Hours
of Time


Generate growth far exceeding expectations with our Overlapping Circles Showing Three Set Venn Connections. It will guarantee abundance.
People who downloaded this PowerPoint presentation also viewed the following :
Content of this Powerpoint Presentation
Description:
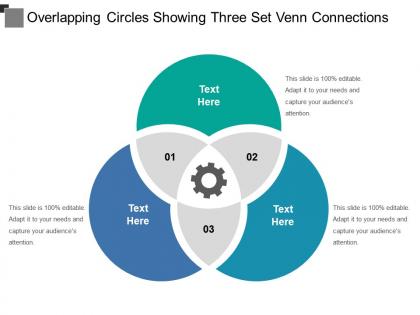
The image depicts a PowerPoint slide titled "Overlapping Circles Showing Three Set Venn Connections." The slide features a Venn diagram composed of three overlapping circles in different colors, each with a space for text. The overlapping sections of the circles are numbered "01," "02," and "03," and each has a gear icon, which typically represents processes or systems that work together.
The text "Text Here" in each circle indicates placeholders where specific information related to each category or sector can be entered. The statement "This slide is 100% editable. Adapt it to your needs and capture your audience's attention." is a reminder that the slide is customizable for the presenter's specific content.
Use Cases:
Venn diagrams are used to show all possible logical relations between a finite collection of different sets. They can illustrate areas of overlap and distinctness in various contexts. This type of diagram is useful across multiple industries for a variety of purposes:
1. Marketing:
Use: Explaining customer segmentation and targeting strategies.
Presenter: Marketing Director
Audience: Marketing team, stakeholders
2. Healthcare:
Use: Demonstrating the relationship between different healthcare services or patient groups.
Presenter: Healthcare Administrator
Audience: Medical professionals, hospital staff
3. Education:
Use: Visualizing the intersection of different academic disciplines or educational strategies.
Presenter: Academic Dean
Audience: Faculty members, educational planners
4. Information Technology:
Use: Showcasing how different systems or software applications integrate.
Presenter: IT Manager
Audience: Technical teams, end-users
5. Environmental Services:
Use: Illustrating the interconnection of ecosystems, conservation efforts, and human impact.
Presenter: Environmental Scientist
Audience: Policymakers, community groups
6. Financial Services:
Use: Displaying the overlap of investment strategies, market segments, and risk management.
Presenter: Financial Analyst
Audience: Investors, financial advisors
7. Human Resources:
Use: Outlining the commonalities between various HR functions like recruitment, training, and employee engagement.
Presenter: HR Director
Audience: HR team, company executives
Overlapping circles showing three set venn connections with all 5 slides:
Emerge as a contender with our Overlapping Circles Showing Three Set Venn Connections. They will help you gain a good foothold.


FAQs for Overlapping circles showing three
So Venn diagrams are just circles that overlap, right? Usually 2-3 of them representing different groups or categories. The overlapping parts show what they share in common - honestly, they're kind of genius for making complex stuff visual. I see them constantly in presentations. People use them for comparing products, showing audience segments, or figuring out how teams work together. That middle overlap area? That's where you find your goldmine - shared features, target markets, whatever you're looking for. My advice: start with two circles and make your labels super clear. Don't overcomplicate it.
Dude, Venn diagrams are honestly perfect for this stuff. You know how your brain gets fried trying to compare datasets in spreadsheets? These things just make it visual instead. The overlapping parts show you what's shared, and you can instantly see what's unique to each group. Presentations become way less painful too - people get it immediately instead of glazing over at bullet points. I started using them for customer segments last month and boom, patterns I'd been missing for weeks just popped out. Sometimes the simple solutions work best, you know? Give it a shot next time you're drowning in comparisons.
Biggest thing? Don't cram tons of text into each circle - people will just give up reading it. Keep labels super short. Also make sure your circles aren't tiny and that overlapping parts are actually clear. I've literally seen ones that look more like modern art than anything useful lol. Your overlapping sections need to make sense logically too. Use colors that contrast well so everyone can read it from wherever they're sitting. Oh and here's what I always do - step back from your screen when you're done. Can't read it easily? Then nobody else will be able to either.
So basically, you need multiple circles when comparing three or more things and their overlaps. Two circles? Fine for simple stuff. But say you're looking at customers by age, income, AND location - now you need that third circle to show how everything connects. Honestly, I'd stick with three circles max. Four gets ridiculously messy to read. Three works great for market research or survey data where people fit multiple categories. Just double-check your audience can actually make sense of all those intersection areas - some diagrams end up looking like abstract art!
Honestly, interactive Venn diagrams are a game changer! Try PowerPoint's morph transitions to reveal sections bit by bit - it's way more dramatic than just showing everything at once. Canva's hover effects are pretty slick too. But here's what really works: get people involved. Use Mentimeter or similar tools so your audience can actually vote on what belongs in each circle. Makes them feel invested, you know? Oh, and Prezi's good if you want that zoomy presentation vibe. The whole point is ditching those boring static slides that put everyone to sleep.
Canva's probably your best bet if you want something that looks good without much effort - their templates are actually pretty decent. Lucidchart's great too, especially if you're working with other people since the sharing stuff works smoothly. PowerPoint can work in a pinch if you're already used to it, though honestly it gets annoying for anything complicated. Visme and SmartDraw give you more control if you're picky about customization. Google Drawings is free and does the basics fine. I'd go with Canva first - it's just easier to make something that doesn't look terrible.
Oh totally - this is so real! Reading patterns mess with how people scan diagrams. Like, some cultures read right-to-left so they'll hit different sections first. Colors are a whole minefield too since red means totally different things depending where you are. Honestly, I bombed a Tokyo presentation because of this exact thing. My advice? Label the hell out of everything and use boring neutral colors. Then just walk people through it step by step instead of assuming they'll connect the dots like you do.
Oh totally! Venn diagrams are clutch for non-math stuff too. English teachers love using them to compare characters across different books - honestly works way better than you'd think. You can map overlapping themes in literature, or like in sociology, show how different social groups intersect. Political science profs use them for policy analysis all the time. Philosophy too, though that gets weird fast. The trick is focusing on shared traits instead of actual numbers. Next time you're breaking down something with overlapping parts, just sketch circles and see what happens. Really clears up messy ideas.
John Venn invented these back in 1880 - British guy who was into logic and wanted a better way to show how sets relate to each other. Euler had done something similar with circles before, but Venn made it way more structured. These days they're everywhere in presentations. Marketing teams use them for audience overlap, strategy folks compare features - honestly, they've gotten a bit overused if you ask me. Just don't go crazy with too many circles or you'll lose people. Two or three max, otherwise it gets messy fast.
Honestly, Venn diagrams are clutch for this stuff. They make overlapping ideas super visual, so you can actually see where different approaches connect instead of everyone just talking over each other. I've noticed people get way more specific about what they mean when they have to draw it out - something about slowing down to sketch forces clearer thinking. You'll spot logical gaps that totally get lost in regular conversation. My favorite trick? When a meeting's going nowhere, just grab the whiteboard and start mapping everyone's viewpoints. Works every time.
Dude, animated Venn diagrams are honestly a game changer for presentations. You can build up the overlaps bit by bit instead of dumping everything on people at once. Movement catches attention way better than boring static slides - I mean, our brains are basically wired to notice things that move, right? It's perfect for storytelling too. You'll create this nice buildup as circles slide together or fade in to reveal those key connections. Just stick with simple transitions though. I've seen people go overboard with crazy effects that end up being more distracting than helpful.
Honestly, Venn diagrams work in basically any class if you think of them as brainstorming tools first. Two circles are perfect for comparing lit characters or historical events - kids get genuinely excited when they spot connections they missed before. Three circles get messy but that's where the real analysis happens. Make them hands-on though! Sticky notes they can actually move around, or let them argue about where stuff belongs (they love being right). Oh, and don't save them just for the end - I use blank ones at the start and we fill them together while I'm teaching. Works way better than you'd think.
Oh dude, Venn diagrams are actually super useful! When I'm planning parties, I map out what my friends are all into so I don't pick something half of them will hate. Also great for comparing Netflix vs Hulu vs whatever - you'll be shocked how much you're double-paying for the same shows. I use them for cooking too, like what I have in my fridge versus what my roommate will actually eat (spoiler: very little overlap). Social media people love them for finding audience crossovers. Honestly, anytime you're comparing groups of stuff, just draw some circles and watch the magic happen.
Honestly, colors are a game changer for Venn diagrams. Your brain processes visual info way better than plain text - it's just how we're wired. Use different colors for each circle and maybe throw in some icons or patterns. Makes everything stick better in people's heads. Nobody's gonna remember some boring black and white circles, right? High contrast combos work best, especially on screens. Oh, and if you're doing a whole presentation, keep your color coding consistent throughout. Creates those mental connections. Brand colors are perfect if you have them, but really any combo that pops will do the trick.
Honestly, Venn diagrams are clutch for business stuff. You can map out customer segments, product features, whatever - and actually see where things overlap instead of just guessing. Super helpful when you're trying to nail down your target audience or figure out which features matter most. I swear they make stakeholder meetings way smoother since everyone gets the visual. Sometimes I overthink it and make like 5 circles, but usually 2-3 works best. Next time you're weighing options, sketch out your key requirements as circles and see what lands in that sweet spot where they all meet.
-
Best Representation of topics, really appreciable.
-
Awesome presentation, really professional and easy to edit.