

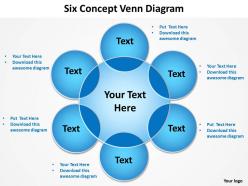
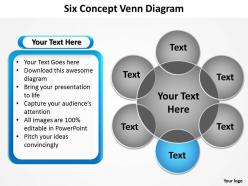
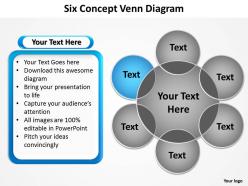
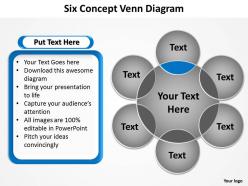
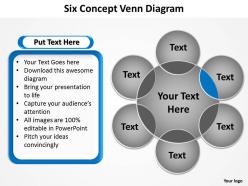
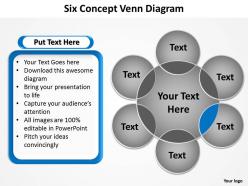
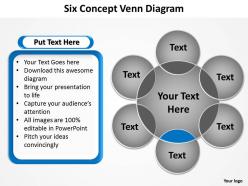
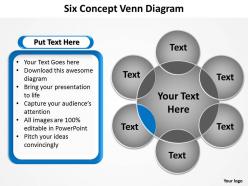
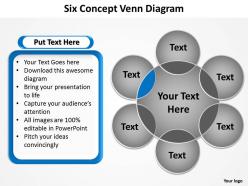
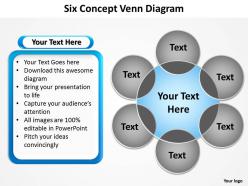
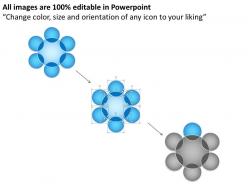
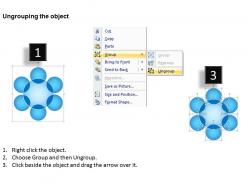
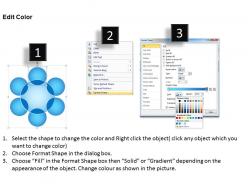
Six concept venn diagram with big ring in center and circles powerpoint diagram templates graphics 712





Try Before you Buy Download Free Sample Product
 Impress Your
Audience
 100%
Editable
 Save Hours
of Time


Sit back, relax and let your thoughts flow. Our six concept venn diagram with big ring in center and circles powerpoint diagram templates graphics 712 will work out the rest for you.
People who downloaded this PowerPoint presentation also viewed the following :
Six concept venn diagram with big ring in center and circles powerpoint diagram templates graphics 712 with all 17 slides:
Our six concept venn diagram with big ring in center and circles powerpoint diagram templates graphics 712 are like satin sheets. Use them and you will dream big.

FAQs for Six concept venn diagram with big ring in center and circles powerpoint diagram
Oh dude, Venn diagrams are perfect for this stuff! They show overlaps between data sets - like which customers bought both products A and B. Way better than drowning in spreadsheets (been there, it sucks). Use them when you're exploring data and trying to figure out relationships between groups. Honestly, stakeholders love the visual aspect way more than boring pivot tables. Short sentences work. But they're also great for comparing customer segments or seeing which features get used together. You'll save yourself so much time explaining findings. Super practical for spotting patterns you'd totally miss otherwise.
Honestly, Venn diagrams are total lifesavers in the classroom. Kids finally "get it" when they can see how concepts overlap visually - way better than just talking at them about it. I use them for everything, from basic math sets to comparing characters in books or historical events. The magic happens when you let students make their own instead of just showing them a finished one. They actually remember stuff when they're the ones drawing the connections. Oh, and adults love them too - my colleague uses them in her college lit classes and swears by them. Short answer: they work.
Oh dude, Venn diagrams are seriously a lifesaver for this stuff. You know when you're trying to compare like three different things and your brain just... stops working? That's where these come in. They turn all that messy overlapping info into something you can actually see. The circles show you what's shared, what's totally different, and what kinda overlaps. Works for anything too - customer groups, product features, whatever you're analyzing. I use them way more than I probably should, but honestly? They just make everything click. Next time you're drowning in comparison data, just sketch one out real quick.
Honestly, stick to 2-3 circles tops - more than that and it looks like a hot mess. Make your labels super specific so there's no confusion about what goes where. I learned this the hard way when I made one last year and nobody could figure out what I was trying to show. Use colors that actually contrast (not like navy and black, ugh). The overlapping parts should make sense naturally - don't force connections just to fill space. Oh, and if you're showing different amounts, make the circles proportional. Test it on someone first. If they look confused, you probably need to dial it back.
Honestly, Venn diagrams are perfect for showing overlaps between groups - something bar charts and pie charts just can't handle. Like if you're comparing datasets and need to see what they share? That's where Venn diagrams shine. Way clearer than trying to explain it with words or cramming everything into a table. Bar charts work for comparing amounts, flowcharts for processes, but Venn diagrams own the overlap game. Just don't go crazy with them - anything more than 3 or 4 circles gets super messy real quick. Next time you've got relationship data, sketch one out first!
Honestly, there's a bunch of good options for Venn diagrams. Canva's probably your best bet if you want something quick - super easy to use and free. Google Drawings works too. Lucidchart and draw.io are better if you need more fancy customization stuff. PowerPoint actually isn't terrible either, though getting the circles to line up perfectly is kinda annoying (learned that the hard way). Oh, and if you're doing any data analysis work, both R and Python can generate them automatically from your data, which is pretty cool. I'd just go with Canva first though.
Ugh, don't even get me started on Venn diagrams with more than 3 sets - they turn into this chaotic mess that nobody can read. They're terrible for showing hierarchies too. The worst part? Circle sizes almost never match the actual data, so you're basically lying to your audience without meaning to. I swear people just throw them into presentations because they look "smart" when a basic table would work way better. Tree diagrams are so much cleaner for complex stuff. Sometimes bullet points are honestly your best friend.
Honestly, Venn diagrams are clutch for this stuff. When you're stuck between options, just draw circles for each choice and fill in the overlapping parts with what they share. The unique stuff goes in the non-overlapping sections. I've done this for job decisions - like mapping out salary, location, company culture, etc. Makes it so much easier to see patterns instead of just having random pros and cons floating around in your head. Also works great for comparing anything really - apartments, cars, whatever. Give it a shot next time you're overthinking a choice. Way better than making endless mental lists that go nowhere.
Yeah, they're actually pretty solid for marketing stuff! I use them to map out customer segments and find where different groups overlap - like when you've got eco-friendly buyers who are also budget shoppers. That's your goldmine right there. You can also compare your product features against competitors to see what you're missing or where you're crushing it. Honestly took me way too long to realize how helpful they are. Try sketching one out for your next campaign - it'll show you exactly where to focus your messaging instead of just guessing.
Here's the thing - most people see overlapping circles and immediately think "oh, this causes that!" But really, you're just looking at correlation or shared traits. Also, don't ignore the stuff outside the circles - that's still part of your data set. Circle size usually doesn't mean anything either, which honestly catches people off guard all the time. The non-overlapping parts matter just as much as where things intersect. I'd say always figure out what each section actually represents first. Just because something's not in the overlap doesn't mean it's completely absent from your data.
So Venn diagrams are just circles that show how different groups overlap - super simple but really useful. Each circle is a set, and wherever they cross over shows what's shared between them. The parts that don't overlap? Those are the unique stuff in each group. I actually use these way more than I thought I would after school lol. You can see unions and intersections clearly instead of trying to picture it in your head. Honestly, just draw one out next time you're sorting through data or trying to compare things. Makes everything way clearer.
Oh totally! Those standard circle ones are just the beginning. Custom shapes work great - like house shapes for real estate data or whatever fits your topic. I've seen people use different sized shapes too, where bigger = more data, which honestly looks way cooler than regular Venn diagrams. You could try squares, triangles, or go wild with 3D versions if you're feeling ambitious. There's also Euler diagrams but that's getting into the weeds a bit. Really just pick whatever tells your story best and doesn't confuse people.
So you basically draw circles for different market segments or customer needs, then plot where each competitor sits. The overlapping parts? That's your direct competition. Empty spaces are goldmine opportunities nobody's hitting yet. I actually love doing this because you'll spot stuff that's not obvious otherwise. Like realizing two competitors you thought were rivals are actually targeting completely different customers. Or finding that perfect gap everyone's somehow missed. Grab your top 4-5 competitors and sketch it out next strategy session. Takes like 20 minutes but seriously changes how you see the whole landscape.
Oh man, Venn diagrams are seriously underrated for team brainstorming! They show you exactly where everyone's ideas connect - super helpful when you're stuck in those endless debates where people keep talking past each other. I use them all the time now to balance different constraints or find middle ground between competing solutions. The visual thing just clicks with people, you know? Plus they're great for spotting gaps where nobody's even thinking yet. Next time your team's going in circles, just grab a whiteboard and start drawing those overlapping circles together. Game changer.
Okay so first thing - ditch the jargon completely. Say "factors" instead of "variables," that kind of thing. Pick examples that work across different fields, not just yours. Honestly, the best move is getting someone from each discipline to look at your diagram beforehand. Trust me, it beats dealing with confused faces later. Color coding helps tons too - use different colors or fonts for each domain. Oh and label everything clearly! Same words mean totally different things to different people. Like "significant" to a statistician vs. a regular person, you know?
-
Commendable slides with attractive designs. Extremely pleased with the fact that they are easy to modify. Great work!
-
Unique research projects to present in meeting.