

 Customer Reviews
Onion diagrams are among the most commonly used data visualization tools. Every executive or manager will come across these pictorial charts at least once in their corporate career.
The reason for that is not unfounded either.
You see, there are applications galore when it comes to using onion diagrams as a component of stakeholder analysis besides other expressions related to a project. As long as projects keep coming up, an onion diagram will always be a necessity for fulfilling requirements of stakeholder mapping and related procedures.
So if you are new to the wonders of onion diagrams or are exploring them to hone your creative flair for business presentations, here’s a quick primer replete with an easy tutorial and editable PowerPoint templates. Let’s peel this onion, layer by layer (no tears, guaranteed).
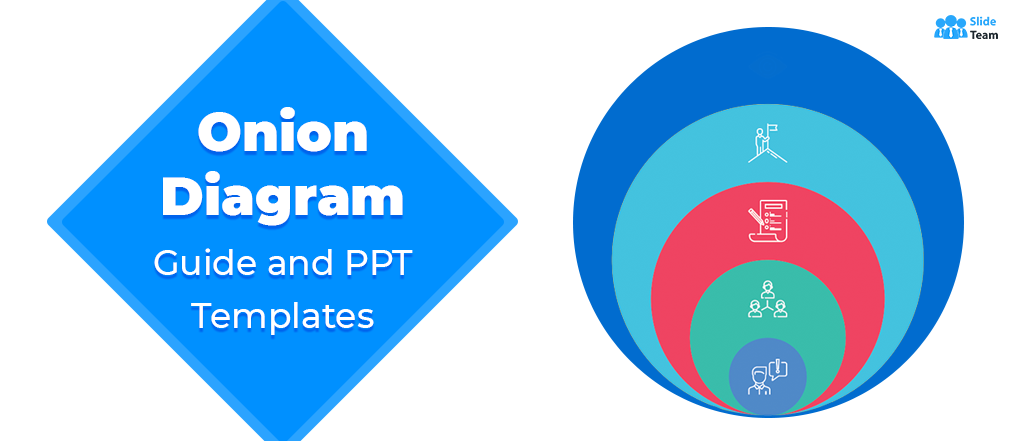
What is an onion diagram?
An onion diagram, or onion chart, or onion graph, or onion model, is a graphical representation of dependencies within an organization or a system. Just like the layers of an onion, the diagram showcases relationships between entities within concentric circles, each representing a level of dependency in the hierarchy of that particular system.
Onion models have emerged as a handy graphical tool to map hierarchies represented by the tree model. The logic is simple. Each pecking order in the latter is placed inside each corresponding ring of the diagram. The main subject of the entire setup, i.e. an idea or a product, is kept at the center of the diagram. In systems with multiple chains of command, the stakeholders dealing with the idea (directly or indirectly) are designated by distinct points connected with arrows.
Such unique arrangement imparts onion diagrams visual clarity, which helps users in project planning, stakeholder analysis, communication planning, and risk redressal. The only con of onion charts is that multiple dependencies can be harder to visualize and are more prone to being misinterpreted. This is why onion diagrams serve very well for picturing low to mid-level projects.
Variants of onion diagrams have been also used to map computing and networking models besides cultural influence on human behavior according to their location, environment, beliefs, etc.
How to make an onion diagram?
Structurally, there are two variants of onion diagram — the first with concentric circles and the second with a stacked Venn diagram. As we visualized the concentric variant before, this section will cover how to create the Venn diagram variant in PowerPoint in four easy steps. The only thing that differs here is the design. The steps will remain the same for both the variants. So get your pen and pad ready, and launch PowerPoint on your computer to get started.
Step 1: Define the outermost ring
We follow the top-down approach here. The outermost ring of your onion diagram will contain the lowest level of the stakeholder hierarchy. We are taking the example of a restaurant point-of-sale (POS) software. So the outermost ring will contain the ecosystem which the business is in. This will have your competitors, customer, regulator, and the like. Jot these points down.
Step 2: Define the inner layers
The inner layer (we are considering third) will have secondary stakeholders. Here for a POS, we are considering sponsor, executive, and subject matter expert (SME) for the third layer. The second layer can have the primary stakeholders, such as project manager, developer, and tester. The innermost layer will have your product, i.e. the software. Jot these down too.
Step 3: Plot the stakeholders
It’s time to make things graphic. In PowerPoint, go to Insert > SmartArt > Relationships.


Scroll through the given options and choose Stacked Venn. For drawing a concentric variant, you can choose Basic Target.
Once you have adjusted the diagram on the slide, assign a stakeholder to each label you want to include in the rings.

Step 4: Designate relationships
Now demarcate the relationships between stakeholders. Solid lines with arrows can be used for symbolizing strong direct relationships. Dotted lines can represent informal or indirect relationships. Once you plot these, your creative onion chart looks like this.

Some PowerPoint templates for you to visualize onion model
No doubt, an onion diagram is a great visualization tool for every project you can possibly envision. It helps clarify any dependencies and is, thus, a crucial part of your project presentations and collateral.
Granted, that you may not always have the time or mental space to draw the perfect onion model for your organization. What does work, however, is choosing from actionable and editable designs.
That’s what SlideTeam’s onion diagram templates are for!
Crafted in PowerPoint to meet your unique business requirements, these completely customizable template designs will fit any project presentation you want. So scroll through these PPT designs, and let onion charts add a new spice to your stakeholder representation.
Template 1
Start off simple with this crisp onion diagram template. With a complementing color scheme, this PPT design will accommodate all of your crucial content for fruitful analysis. Click the link below and get started.

Template 2
This handy onion chart template makes power mapping super easy. With each hierarchical layer showcasing members in a linear fashion along the sectors of the diagram, this template will surely help you make a positive impact. Ease of reading is a plus for this design as well.

Template 3
This PowerPoint layout clubs succinct design with color codes to ensure maximum visibility and comprehension. Offering a stacked Venn diagram variant of the onion model, this flexible template can help you express project workflows and entities clearly. So choose this template and make a lasting impression.

Template 4
Budding companies and project managers can utilize this handy PowerPoint design to illustrate a 6-layered stakeholder representation. Just replace the dummy text with your information and you are ready to present your plans with panache. So click below and make this stunning template yours.

Template 5
Here’s an out-of-the-box application of an onion diagram. This PPT design shines the spotlight on your vision and mission statement. Your viewers can easily absorb the information presented on this spacious slide. The simple design makes it even more digestible.

Template 6
Want to try the 3-D approach to onion diagram? Here’s an amazing visual template that highlights your project topic/idea with a striking model. The clutter-free design can inspire your stakeholders to achieve precision and perfection with collaboration. The entire slide is yours to customize. So click below to get started.

Template 7
Here’s a template design you would rarely find in the default PowerPoint library. This three-staged onion diagram puts a creative spin on the traditional graphic, enabling more expressive communication of project ideas. The concentric design is easy to grasp. So incorporate it into every brainstorming session you have with your team.

Template 8
Dialog pop-ups are the best feature of this PPT design. You can represent additional information apart from collaborator labels into the dialog boxes in this three-staged onion chart layout. So pick this template and have productive discussions.

Template 9
It’s understandable to avoid clutter on your slides. With this flexible four-staged design, you can illustrate the key roles and responsibilities of each hierarchical level in your system. Feel free to alter the text, color scheme, and font of this handy template. Just click below and deploy this design immediately.

Template 10
Infuse this five-staged 3-D onion chart with relevant information, and you will be ready to impress your audience in no time. A fully editable design, this template will fit well with any project presentation you develop. So without further ado, choose this ultimate slide to leave a lasting impression.
![]()
In a nutshell, an onion diagram is your best bet for any kind of visual analysis. The context may vary from project to project. But that’s the beauty of having such a practical tool with you at the ready. It makes process communication and regulation seamless. So deploy SlideTeam’s onion diagram templates and get chopping.
P.S: For more tips on data visualization, check out our handy guide and templates here.