


Power BI Report Development Workflow




Try Before you Buy Download Free Sample Product
 Impress Your
 Audience
 100%
100% Editable
 Save Hours
 of Time


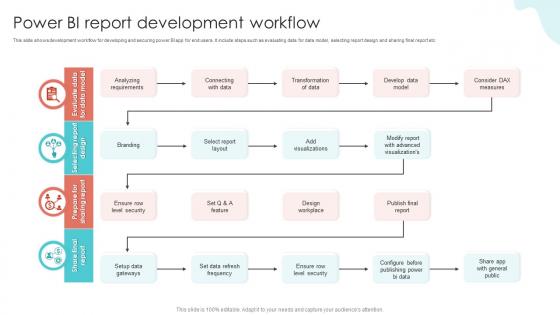
This slide shows development workflow for developing and securing power BI app for end users. It include steps such as evaluating data for data model, selecting report design and sharing final report etc.
People who downloaded this PowerPoint presentation also viewed the following :
Power BI Report Development Workflow with all 6 slides:
Use our Power BI Report Development Workflow to effectively help you save your valuable time. They are readymade to fit into any presentation structure.





FAQs for Power BI
Okay so first figure out what you actually need this thing to do - like what questions are people gonna ask? Then map out your data sources and how they'll connect before you even open Power BI. Connect your data, clean it up (this part's always messier than you think), build relationships between tables. After that you can start making your visuals and reports. Test everything thoroughly because trust me, someone will find that one weird edge case that breaks everything. Once it's solid, publish it, set up your refresh schedules, and don't forget the security permissions or you'll get angry emails.
Dude, automation is such a lifesaver for Power BI. No more manually refreshing data every morning - you can schedule all that stuff to happen automatically. Same with report deliveries to stakeholders. I swear I used to spend like 30% of my day just on repetitive tasks. Now my dashboards stay updated without me touching anything, and people get their reports delivered right to their inbox. You'll actually have time for the interesting analysis work instead of babysitting data refreshes. Start with automating whatever you do most often - probably data refreshes. That's where you'll see the biggest time savings right away.
So data modeling is where you set up how all your tables talk to each other in Power BI. Think relationships, calculated columns, measures - all that foundational stuff. Not gonna lie, it's pretty boring compared to making fancy visuals. But trust me, skip this step and your reports will run like garbage. I learned this the hard way on my first project. Get your star schema sorted early and everything else just clicks. Your dashboards will actually load fast and won't break every time someone asks for a new metric.
Set up automated refresh schedules first - that'll save you so much time. Dataflows are your best friend for centralizing data prep work. I literally spent weeks redoing the same transformations before I figured this out. Build reusable data sources in the Power BI service so multiple reports can pull from identical clean datasets. For huge datasets, incremental refresh is clutch since full reloads take forever. Honestly the whole thing's about building once and using everywhere. Start with whatever data sources you're constantly pulling from and create dataflows for those.
Run your refreshes when nobody's online - early morning or late evening works best. Figure out when your source data actually updates first, then schedule around that. Honestly, don't get refresh-happy just because you've got 8 daily refreshes with Pro. If your data only changes once a day, hourly refreshes are pointless and you'll blow through your quota fast. Set up those failure notifications too - trust me, you'll want to know immediately when things break. Map out your upstream sources first. Then work backwards from when users actually need the fresh data.
Honestly, Power BI's collab features are pretty solid. Your team can work on the same reports without the usual mess. Set up workspaces with proper permissions, then everyone can share dashboards and leave comments right on the visuals. Game changer for getting feedback, trust me. No more of that "Report_Final_FINAL_v3" nightmare thanks to version control. You'll love the automatic refreshes and alerts too - keeps everyone on the same page with fresh data. Oh, and definitely start with a dedicated workspace for your next project. Just invite your team with the right access levels and you're golden.
Think about data security from the start - use service accounts with minimal permissions instead of your own login. Set up row-level security so people only see what they should. This stuff gets messy quick, trust me. Classify your datasets properly and lock down workspace access to essential people only. Oh, and audit permissions regularly - they spiral out of control faster than you'd think. I'd start by mapping out what you have now and spotting obvious holes. The basics will get you pretty far before you need to worry about the complex stuff.
Variables are a game changer for DAX - they store calculations so you're not doing the same work over and over. Skip the nested IF statements and go with CALCULATE instead. RELATED functions in measures? Don't do it if you can fix your data model instead. I know it sounds like extra work, but trust me on this one. Your slowest visuals probably have measures calling other measures repeatedly - that's where you'll see the biggest wins. Oh, and the performance difference on large datasets is actually ridiculous.
Biggest mistakes? Data modeling and not thinking through your refresh schedule from the start. Don't import columns you don't need - trust me, it makes everything sluggish. Also skip setting up table relationships properly and you're screwed. DAX measures need optimization too, and please validate your data before going live. I've watched people launch dashboards with completely wrong numbers, it's painful. Oh and another thing - cramming too many visuals makes reports unusable. Nobody wants to stare at a cluttered mess. Figure out what questions you're actually trying to answer first, then work backwards.
Oh man, Power BI connects to literally everything in the Microsoft world - Excel, SharePoint, Teams, you name it. Azure integration is solid too if you need heavy data processing. Honestly, Power Automate is where it gets cool though - you can set up automatic report refreshes or get pinged when your numbers hit certain thresholds. Plus it embeds pretty much anywhere, like Salesforce or your company's intranet. There's like 100+ connectors available, which is kinda nuts. I'd figure out what's annoying you most in your current setup first, then see if Power BI can automate those headaches away.
First thing - fix your naming mess. "Sales_Data_Final_FINAL_v2" is the stuff of nightmares, seriously. Set up shared datasets so multiple reports aren't duplicating everything. Organize your workspace folders properly (like actually organize them). Row-level security is clutch if teams need different access levels. Dataflows help when you've got the same transformations happening everywhere. Think of it like organizing your music library - everything needs a home. Start by seeing what disaster you're working with currently, then clean it up from there.
Honestly, user feedback is like gold for your Power BI stuff. People complain about slow dashboards or can't find what they need? That tells you exactly where to focus. I've fixed so many things that seemed minor but actually bugged everyone daily. Set up regular check-ins - maybe monthly - to actually ask what's working and what isn't. Don't just assume you know what they want (I learned this the hard way lol). Quick surveys work, or even just grab coffee with whoever uses your reports most. The trick is building that feedback loop so you're constantly tweaking based on real problems, not imaginary ones.
Dude, version control is a game changer for Power BI work. Basically you can track what changed and when, plus roll stuff back if you mess something up. Multiple people working on the same project? No problem - no more of that nightmare where someone overwrites your work (ugh). Git works great with PBIX files, or you could try Power BI's deployment pipelines instead. Honestly the backup alone makes it worth it. Just start with simple branching - you'll kick yourself for not doing this sooner. Way better than the chaos of "final_report_v2_ACTUALLY_FINAL.pbix" everywhere.
Dude, visual storytelling is a game changer for Power BI dashboards. Don't just dump 20 random charts on people - that's honestly just lazy. Map out your story first, then build visuals around it. Start big picture, then get into the details. It's like making a good presentation, you know? Use colors that make sense together and write titles that actually explain what matters, not just "Sales by Region" or whatever. Place things strategically so there's a logical flow. This way people can actually follow along instead of getting overwhelmed trying to decode everything themselves.
Honestly, start with usage metrics - they'll tell you right away if people actually care about your reports. Check who's using what and how often. Data refresh rates matter too, plus how fast your queries are running. Don't skip user satisfaction surveys either, even quick ones work. Development cycle times are worth tracking since nobody wants reports that take ages to build. Oh, and definitely monitor data quality issues - how fast you're fixing those says a lot. I'd probably focus on the usage stuff first though, it's the most telling indicator of whether you're building something useful or just pretty dashboards nobody opens.
-
Definitely a time saver! Predesigned and easy-to-use templates just helped me put together an amazing presentation.
-
Awesome use of colors and designs in product templates.