

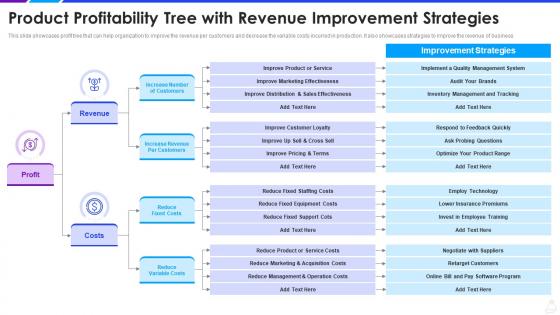
Product profitability tree with revenue improvement strategies




Try Before you Buy Download Free Sample Product
 Impress Your
 Audience
 100%
100% Editable
 Save Hours
 of Time


Our Product Profitability Tree With Revenue Improvement Strategies are topically designed to provide an attractive backdrop to any subject. Use them to look like a presentation pro.
People who downloaded this PowerPoint presentation also viewed the following :
Product profitability tree with revenue improvement strategies with all 6 slides:
Use our Product Profitability Tree With Revenue Improvement Strategies to effectively help you save your valuable time. They are readymade to fit into any presentation structure.
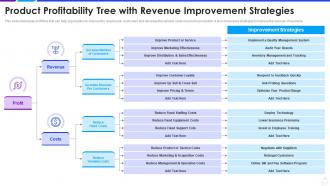





FAQs for Product profitability tree with
So you've got two big buckets - revenue and costs. Revenue breaks down into price per unit times how many you sell. Costs get split between variable stuff (materials, labor per unit) and fixed expenses like rent and salaries. Honestly, the coolest part is seeing how tiny changes can blow up your profits - like a 5% price bump might literally double what you make. I'd start with your biggest cost categories first, then get into the weeds from there. You can go crazy detailed with marketing spend, shipping, all that if you want.
Okay so basically a profitability tree takes your costs and breaks them down into smaller pieces instead of just staring at one giant number that makes you want to cry. You can actually see which categories are burning through your cash the fastest. Think of it like getting X-ray vision for your finances - you'll spot the bloated areas compared to what they should be. Honestly, the visual part is clutch because it shows you which cuts will actually matter versus the tiny stuff that won't change anything. Start with your three biggest cost areas and go deeper from there.
So revenue segmentation is just breaking down where your money's actually coming from - like by customer type, features, pricing plans, whatever. Think of it like checking under the hood to see what's working vs what's broken. Honestly, most people skip this step and then wonder why they're bleeding cash. Without it, you might assume everything's profitable when really one segment is propping up the rest. I'd start with your biggest money makers first, then dig into the smaller stuff. You'll spot the winners and losers pretty quick once you see the real numbers.
Hey! So when you're building that profitability tree, definitely split your costs into fixed vs variable. Fixed stuff like rent and salaries stays the same no matter what - could be selling 10 units or 10,000. Variable costs though? They move with your volume. Materials, shipping, all that scales up and down. I always do two branches under "Total Costs" because honestly, it makes break-even analysis way cleaner. Plus you can actually see what happens to your margins when volume changes. Super helpful for pricing decisions later on.
Honestly, you gotta look at both sides - revenue AND costs. Track your unit sales, pricing, customer acquisition costs. Then dig into COGS, marketing spend, operational expenses (yeah, it gets messy but whatever). Customer lifetime value is huge too, plus churn rates since those really mess with your long-term numbers. Oh and don't skip market share stuff - competitive positioning matters more than people think. I'd start with these basics first. You can always get fancier with the metrics later once you've got the foundation down.
Look, profitability trees are game-changers for figuring out where your money actually comes from at each product stage. You'll quickly spot which features or customer segments drive real profit instead of just flashy revenue numbers - seriously, this stops you from chasing metrics that don't matter. Breaking down your complex P&L into bite-sized pieces makes bottlenecks way easier to find. Then you can focus on stuff that actually moves your bottom line. Oh, and next time you're doing roadmap planning? Start with mapping profit drivers first. Makes everything so much clearer, trust me.
Don't overcomplicate your tree from day one - that's the fastest way to get completely lost. Just start with revenue minus costs, super basic. Then break those down step by step. Also, don't jump levels (like going straight from total revenue to individual products without hitting product categories first). Honestly, I see people use percentages for everything but actual dollar amounts tell you so much more about where the money really is. Oh and double-check that your branches add up to the parent - sounds obvious but you'd be surprised. Build it piece by piece and you'll be fine.
Look, your customers basically control how much money you make. The good ones buy often and aren't super picky about price - those are your goldmine. But then you've got the bargain hunters who only buy when there's a sale, which kills your margins. And don't get me started on customers who cost tons to bring in but then hardly purchase anything. Total waste. Your product lineup ends up changing based on what people actually want too, not what you thought they'd want. Honestly, just figure out which customer types make you the most per product, then go after more of those people.
Yeah totally! Profitability trees work great for services. Just swap out the usual stuff - instead of materials and manufacturing, you're looking at labor hours, software costs, office rent, that kind of thing. Services are honestly perfect for this since labor's usually your biggest cost anyway and it fluctuates so much. You'll want to map out your main service pieces first, then work backwards from there. The trick is figuring out what actually drives your costs and revenue in how you deliver the service. Way easier than you'd think once you get started.
Just go with Excel tbh - everyone already knows it and you can tweak stuff super easily. If your boss wants something that looks fancier, Tableau or Power BI work great for visualizations. Some people use Anaplan for really complex stuff, or even Lucidchart if you just need to map out the basic structure first. Honestly though? Don't overthink the tool choice. Pick whatever your team can actually use without needing a training course. Excel handles like 90% of what you'll need anyway. You can always switch later if it's not cutting it.
Quarterly is the bare minimum, but it really depends on your industry. Stable business with predictable costs? Yeah, quarterly's probably fine. Fast-moving stuff with constantly changing margins though - I'd go monthly. Supply chain chaos, new competitors, pricing wars... that stuff can bite you fast. Honestly, I've seen too many people get burned waiting for their regular quarterly check. Set some calendar reminders and pick 2-3 metrics that'll flag when something's off. Better to catch changes early than scramble later when your bottom line's already taking hits.
Look beyond just revenue and costs - customer satisfaction, competitive position, and brand impact matter too. I'd track customer lifetime value trends and market share changes. Sometimes profitable products still get cut because they mess up brand messaging (seen it happen). Operational headaches, supplier drama, and regulatory stuff that isn't hitting your P&L yet could cause problems down the road. Pick 2-3 qualitative factors that actually matter for your situation and track them consistently with your financial metrics. Don't overcomplicate it though.
So basically, profitability trees give everyone the same roadmap to follow. Break down profit into revenue drivers and costs, and suddenly marketing sees how their campaigns hit sales targets. Operations gets why their efficiency work matters for the bottom line. It's honestly pretty cool - like everyone finally speaks the same language instead of working in their own bubbles. Each department can see where they actually fit in the big picture. Oh, and definitely try mapping your current projects on the tree. You'll probably find some weird overlaps where teams are accidentally working against each other.
Market trends will mess with your profitability assumptions big time. Consumer shifts change your revenue forecasts and what you can charge. Economic stuff hits both sides - inflation jacks up your costs while demand patterns shift around. I've watched models fall apart when people ignored this stuff. Tech disruption can wreck your competitive edge, plus regulatory changes add compliance costs you didn't see coming. Build different scenarios into your tree instead of static numbers. Update quarterly and stress-test against whatever trends you're noticing. Way better than getting blindsided later.
Look at what your competitors are actually doing - that's gonna show you if your profit assumptions are realistic or not. I always check out their revenue streams first because you'll find some sneaky ways they make money that you hadn't thought of. Then compare your pricing and costs to theirs. Are you being way too optimistic about how much you can charge or how cheaply you can acquire customers? Probably, honestly. Map out 3-4 main competitors and plug their numbers into your tree. You'll quickly see where your projections might be off.
-
Great experience, I would definitely use your services further.
-
Colors used are bright and distinctive.