


Quarterly Business Review Powerpoint Ppt Template Bundles





Try Before you Buy Download Free Sample Product
 Impress Your
 Audience
 100%
100% Editable
 Save Hours
 of Time


Our Quarterly Business Review Powerpoint Ppt Template Bundles are topically designed to provide an attractive backdrop to any subject. Use them to look like a presentation pro.
People who downloaded this PowerPoint presentation also viewed the following :
Quarterly Business Review Powerpoint Ppt Template Bundles with all 25 slides:
Use our Quarterly Business Review Powerpoint Ppt Template Bundles to effectively help you save your valuable time. They are readymade to fit into any presentation structure.
-

Quarterly Business Review
-
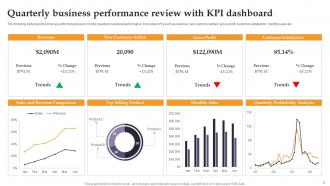
Quarterly business performance review with KPI dashboard
-
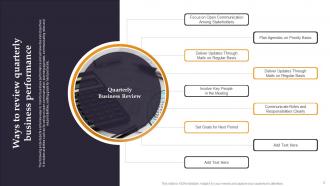
Quarterly Business Review
-
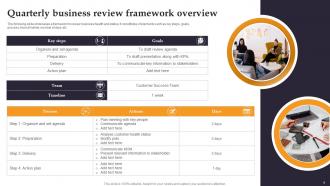
Quarterly business review framework overview
-
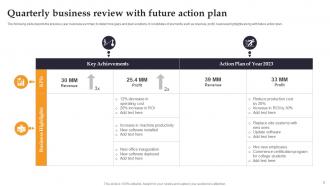
Quarterly business review with future action plan
-
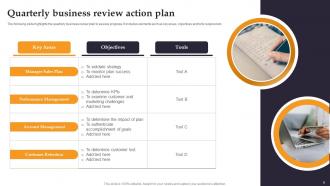
Quarterly business review action plan
-
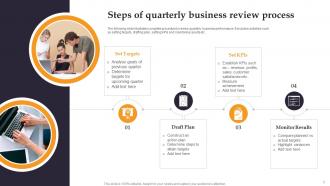
Steps of quarterly business review process
-
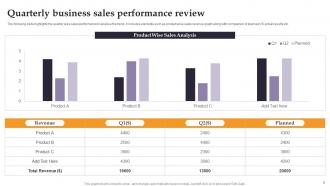
Quarterly business sales performance review
-
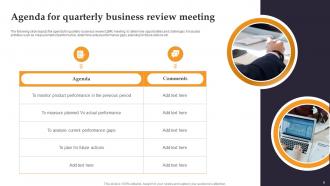
Agenda for quarterly business review meeting
-
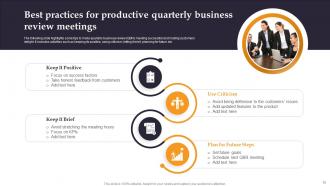
Best practices for productive quarterly business review meetings
-
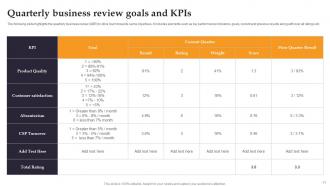
Quarterly business review goals and KPIs
-
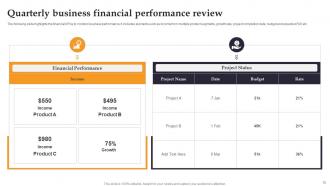
Quarterly business financial performance review
-
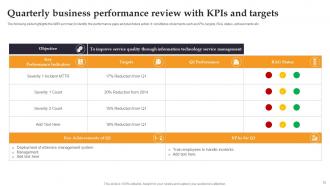
Quarterly business performance review with KPIs and targets
-
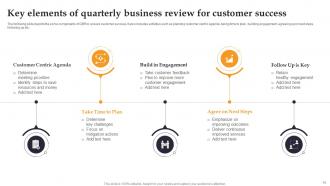
Key elements of quarterly business review for customer success
-
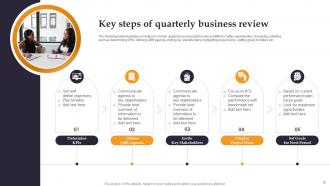
Key steps of quarterly business review
-
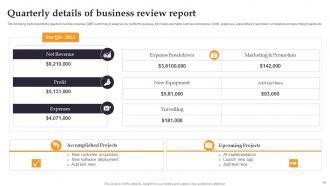
Quarterly details of business review report
-
Quarterly business sales performance review icon
-
Quarterly marketing business review summary Icon
-
Quarterly business review report icon
-

Quarterly Business Review
-

-

-

-

-

FAQs for Quarterly Business Review Powerpoint
Hit these four things: actual numbers against your goals (not vague "we crushed it" stuff), wins plus challenges from the quarter, next quarter's forecast, and what you need from leadership. Don't skip the challenges part - honestly, that's where most people screw up and look clueless. Tell a story connecting past, present, future. Make slides visual but don't just throw spreadsheets at people. Oh, and always end with clear next steps and deadlines so everyone knows what they're supposed to do next.
Skip the raw numbers dump - QBRs are all about spotting trends and patterns instead. Compare this quarter's metrics to previous ones and hunt for growth trajectories or weird dips that actually tell a story. Pretty dashboards are useless if you can't explain what's driving the changes! I always focus on identifying top performers and flagging potential risks early. Your stakeholders want actionable insights, not just data points. Connect everything to real business decisions they can make. Oh, and don't forget to look for seasonal patterns - those always catch people off guard.
Honestly, just pick the numbers that actually matter to your business. Revenue growth and customer acquisition cost are obvious must-haves. Churn rate too - that one's brutal but you gotta face it. Then grab whatever your leadership team won't shut up about (sales pipeline, customer satisfaction, etc). Here's the thing though - don't go overboard with like 15 different metrics. That's just asking for glazed-over eyes in the room. Stick to maybe 5-7 max that actually tell your story for the quarter. And make sure you can explain why each one matters without sounding like you're reading from a textbook.
Honestly, visuals are a game-changer for QBRs. Charts and graphs turn those endless spreadsheet numbers into actual stories people can follow - way better than just reading off revenue figures. Interactive dashboards are clutch because execs can dig into whatever catches their eye mid-presentation. Keep your slides clean though, clutter just confuses everyone. Oh, and stick with consistent colors throughout. One thing I learned the hard way - always have PDF backups ready because tech loves to fail at the worst moments. Trust me on that one.
Look, stakeholder feedback is what makes your QBR actually useful instead of just another boring presentation. I always collect input before, during, and after - you can't make good decisions without hearing from people on the ground. Their perspectives catch blind spots you'd totally miss otherwise and help validate whether your priorities make sense. Plus they'll surface issues that don't show up in your data. Everything from budget decisions to team changes gets shaped by this feedback. Oh, and don't wait for people to volunteer their thoughts - set up surveys or quick one-on-ones beforehand to get the real insights.
Honestly, just do them four times a year like the name suggests. I've seen teams try monthly reviews and it's exhausting - everyone gets burnt out from constant evaluating. Twice a year? You'll miss too much stuff that needs fixing. Four times gives you enough runway to actually implement changes and see if they're working. March, June, September, December works great since it matches up with financial quarters anyway. My calendar's already a nightmare so I'd block those dates ASAP. Oh, and the consistency thing matters more than you'd think.
Ugh, the worst thing you can do is turn it into some boring slide marathon where you just read data at people. Nobody wants that torture session. Don't get trapped rehashing old drama either - focus on what's next instead of pointing fingers. Send stuff ahead of time so people actually show up prepared, not just zoning out. Oh, and don't let that one person hijack the whole meeting (you know the type). Balance is key - celebrate the good stuff but tackle real problems too. Honestly, a little prep goes such a long way here.
Honestly, QBRs are great because you finally get everyone looking at the same numbers instead of just guessing what other teams are doing. I've seen so many "wait, you're working on that too?" moments happen during these meetings. The trick is don't just dump data on people and call it done - that's boring as hell. Actually build in 20-30 minutes for discussion after you show the metrics. Teams start connecting the dots on how their stuff affects everyone else. It's pretty cool when finance suddenly gets why engineering needs those extra resources, you know?
Dude, QBR prep doesn't have to suck if you use the right tools. Set up Tableau or Power BI early in the quarter so your data pulls automatically - trust me on this one. Asana's great for tracking wins and blockers as they happen instead of trying to remember everything later. When you're stuck writing executive summaries at midnight (guilty), AI writing tools actually help get you unstuck. Oh, and those auto dashboards? They make your presentations look way more polished than scrambling with Excel charts. The trick is getting everything automated upfront so you're not dying the week before your QBR.
Look, every QBR covers the basics - financials, operations, market stuff, strategic projects. But here's where it gets interesting: tech companies obsess over user growth and product updates. Manufacturing? They're all about supply chains and production costs. Finance and healthcare get bogged down in compliance requirements (ugh). Retail is wild though - their holiday season QBRs are legitimately stressful to sit through. Customer acquisition costs can make or break their quarter. You gotta tell your data story based on what actually matters in your industry, but don't forget the standard metrics executives always expect.
Dude, get super specific with your action items. Don't do that vague "improve performance" crap - say exactly what you want, like "hit 25% email open rates by March 15th." Always assign owners and deadlines that actually make sense. I swear, I've sat through so many QBRs where everyone's nodding along, then crickets afterward because nobody knew their role. Document stuff as you go, then fire off a summary within 24 hours. Simple format works: what needs doing, who's doing it, when it's due. Oh, and definitely schedule check-ins - monthly works well. Trust me, you'll be so grateful when the next QBR comes around.
Send out a quick survey beforehand asking what people actually want to discuss - then use those responses! Break things up every 15 minutes with polls or quick discussions because honestly, nobody can focus anymore. Skip the generic company wins and share stuff that actually affects their day-to-day work. Give key people speaking roles so they're invested, not just sitting there checking email (we've all been there). Oh, and end each part with who's doing what next - otherwise you'll get blank stares when you follow up later.
Oh man, QBRs across cultures are wild - it's way more than just swapping out the language on your slides. Germans? They want those hard numbers and clear next steps, no fluff. But try that with your Japanese team and you'll probably come off as super rude without building rapport first. Honestly, communication styles matter more than the timezone headaches (though those suck too). I'd dig into each region's business vibe beforehand and tweak your agenda accordingly. Maybe hop on some quick pre-calls with your regional leads? They'll tell you what actually works with their teams instead of you guessing.
Get that recap email out within 24-48 hours with all the decisions, action items, and who's doing what by when. Numbers get forgotten super fast, so definitely include the actual metrics you talked about. Hit up anyone who seemed concerned or had questions during the meeting - do it one-on-one. Also, book those deep-dive sessions now while people still care. Oh, and this part is huge - make a shared tracker for all the commitments. Send weekly updates on how things are going. I've seen way too many QBRs just... vanish because nobody follows through on the action items afterward.
Honestly, start simple with attendance and participation - are people actually showing up and engaging? Then track if action items from these meetings get done (spoiler: they often don't). The bigger picture stuff matters too though. Are your strategic initiatives actually moving revenue or customer satisfaction? I always send a quick survey after to see if people found it valuable or just another time-waster. Dashboard with 3-4 metrics works great for tracking quarter to quarter. Don't overthink it at first.
-
Requested a complete pitch deck. Delivered immediately and with high quality well researched content.
-
I was never satisfied with my own presentation design but SlideTeam has solved that problem for me. Thank you SlideTeam!