


Quarterly project powerpoint ppt template bundles





Try Before you Buy Download Free Sample Product
 Impress Your
 Audience
 100%
100% Editable
 Save Hours
 of Time


Our Quarterly Project Powerpoint Ppt Template Bundles are topically designed to provide an attractive backdrop to any subject. Use them to look like a presentation pro.
People who downloaded this PowerPoint presentation also viewed the following :
Quarterly project powerpoint ppt template bundles with all 21 slides:
Use our Quarterly Project Powerpoint Ppt Template Bundles to effectively help you save your valuable time. They are readymade to fit into any presentation structure.
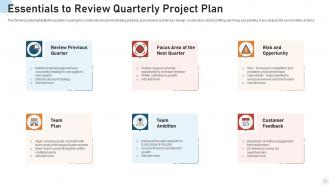






FAQs for Quarterly project powerpoint
For your quarterly template, cover the basics first: project status, milestones you've hit, budget tracking, and what's coming next. Don't forget blockers or risks - those always come up anyway. I personally love adding a "quick wins" section because honestly, stakeholders eat that stuff up. Focus on metrics that actually matter to your audience, not just numbers that look good. Oh, and definitely include team updates since personnel changes explain a lot about project progress. Keep it visual - charts beat text blocks every time. Have backup slides ready with detailed breakdowns for when someone inevitably asks super specific questions.
Honestly, visuals are a game-changer for quarterly presentations. People actually remember stuff when you show charts and graphs instead of drowning them in bullet points. Timeline visuals work great too - way better than trying to explain project phases with just words. I sat through this one presentation last month that was basically a novel on slides, and half the room was checking their phones. Screenshots and simple icons help break things up. Focus on your top three metrics first, then figure out how to visualize those. Makes everything so much easier to digest quickly.
Timeline stuff is huge - track what you hit versus what you missed. Budget's obvious but scope changes matter too, those always sneak up on you. Team velocity shows if people are actually productive or just spinning wheels. Risk indicators are clutch, especially anything that'll bite you next quarter. ROI and business impact metrics when you can get them, though sometimes those are fuzzy depending on the project. Stakeholder satisfaction scores if your company does that whole thing. Just tie everything back to your original goals so your boss can quickly see if you're delivering what you promised.
Show the before/after for each milestone - where you started, what got done, actual numbers. Visuals help too since these updates can be pretty dry. Keep major milestones to 2-3 bullets max. Call out any roadblocks you pushed through and the wins. Here's the thing - don't just dump a task list. Connect everything back to your quarterly goals so people see why it matters. I'd end each section with what's coming next. Gives that sense of momentum, you know? Makes stakeholders feel like things are actually moving forward instead of just... happening.
Honestly, stick with the same template every quarter - exec summary, metrics, wins/challenges, then next quarter's priorities. Charts and progress bars are your friend here because nobody wants to sit through paragraphs of text. Include real numbers, not just "things are going great!" fluff. One point per slide keeps it clean. Oh, and always wrap up with actual action items and deadlines - otherwise people just nod along and nothing gets done. White space is clutch too; cramped slides make everyone's eyes glaze over.
You gotta tailor each presentation to what people actually want to hear. Executives? Hit them with budget numbers and big-picture strategy stuff - they'll zone out if you get too detailed. Your project team needs the nitty-gritty though, like technical roadblocks and who's doing what. Clients just want to see you're fixing their problems and making progress on their goals. Honestly, the easiest trick is keeping one main deck then swapping out like 2-3 slides based on who you're presenting to. Way less work than rebuilding everything from scratch each time.
Okay so first thing - grab them with something shocking. Like a crazy stat or question that makes them go "wait, what?" Then tell it like a story: here's the mess we were dealing with, here's how we tackled it (don't skip the disasters lol), and boom - here's what we pulled off. Personal stories work really well too if you've got one. Show the before/after transformation - people eat that up. Oh, and toss in some rhetorical questions to keep them engaged. Honestly, the ending matters most though. Tell them exactly what you need from them next, otherwise they'll just sit there nodding.
Honestly? Just use PowerPoint or Google Slides - everyone already knows them and they work fine for quarterly stuff. Canva's actually pretty sweet if you want it to look good without doing much work (their templates are way better than they used to be). If you've got tons of data, maybe build your charts in Excel first then copy them over. Figma's cool but only if your team's into design stuff. Really though, just go with whatever you guys are already using regularly. No point switching things up for quarterly updates - that's just asking for technical difficulties during your presentation.
Yeah, totally customize it for whoever you're talking to. Engineering wants sprint data and technical stuff. Marketing cares about campaign numbers and ROI. Sales? All about pipeline and conversions. I've watched so many people bomb with those one-size-fits-all templates - they're useless honestly. Creative teams need portfolio sections and client quotes. Finance folks want budget breakdowns (obviously). Research presentations are different too - methodology matters more than timelines. Just take your basic structure and swap out 2-3 sections based on what each department actually cares about. Way more effective that way.
The biggest mistake? Just filling out the template without thinking about who you're presenting to. You'll end up with something totally generic and boring. Don't stuff every detail into each section just because there's room - I've watched so many people turn these into glorified checklists instead of actual stories. Also, mixing up the format each quarter helps a ton. Sometimes you need to focus more on challenges, other times on wins. Oh and honestly? The best updates I've seen completely customize the template based on what actually matters that period. Your audience will thank you for it.
Honestly, dig through your old presentation feedback first - it's gold. What kept coming up? Missing budget slides? Risk assessments people always asked about after? Those common questions should become standard sections in your template. I'd focus on your last 2-3 presentations and find the top 3 things that always trip you up. Also look at which visuals actually worked vs the ones that made everyone look confused (we've all been there with overcomplicated charts). Short version: let past pain points build your template backbone. You'll thank yourself later when you're not scrambling to add the same missing pieces every time.
Honestly, branding your quarterly templates is huge for looking professional. Grab your company's brand guidelines and make a master template with the logo, official colors, and fonts. Trust me, it's like showing up to a meeting in wrinkled clothes if you don't - people notice that stuff. Your presentations will look way more polished and stakeholders recognize them instantly. Plus leadership takes you more seriously when everything looks consistent. I'd say start simple with just the basics, then you can reuse it every quarter. Makes the whole process smoother too.
Honestly, I'd go with a template that has the same basic structure but lets you swap out the meat of each slide. Start with your standard headers - "Project Overview," "Key Metrics," "Next Steps" - stuff that works for everything. Then just customize what goes underneath. Color coding saved my life when I had like 5 different project types running. Same template, different colors by department. Sounds silly but it actually works. Think of it like having a go-to dinner recipe - you've got your base, but you can throw in whatever's in the fridge. I'd start with maybe 8-10 core slides and see how they work across different projects. You'll probably end up tweaking it anyway.
Honestly, ditch those boring tables and go for some visual stuff instead. Heat maps work great for showing performance - way easier to spot patterns at a glance. I'd start with your best numbers right up front to grab everyone's attention. Interactive dashboards are clutch if you have the time to set them up. Color-coding is your friend too - green for wins, red for problem areas, you get it. Oh, and try building each slide so it connects to the next one, like you're telling an actual story with your data instead of just dumping numbers on people.
Honestly, polls are game-changers - I throw them in mid-presentation and people actually perk up. You could add clickable buttons that jump to different sections, or try live Q&A slides where folks submit questions as you go. Animated charts that reveal data bit by bit work really well too. For virtual stuff, Mentimeter's pretty solid (though I always forget to test the link beforehand, whoops). In-person? QR codes for feedback forms are clutch. Start small - like one interactive thing per presentation and see what sticks.
-
Awesome use of colors and designs in product templates.
-
Very unique, user-friendly presentation interface.
-
Excellent template with unique design.
-
Enough space for editing and adding your own content.
-
Easily Understandable slides.