

Safety Performance Key Risk Indicators





Try Before you Buy Download Free Sample Product
 Impress Your
Audience
 100%
Editable
 Save Hours
of Time


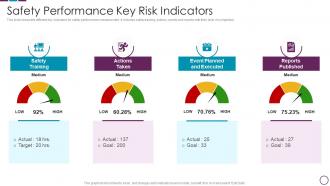
slide shows the different key indicators for safety performance measurement . It includes safety training, actions, events and reports with their level of completion.
People who downloaded this PowerPoint presentation also viewed the following :
Safety Performance Key Risk Indicators with all 7 slides:
Use our Safety Performance Key Risk Indicators to effectively help you save your valuable time. They are readymade to fit into any presentation structure.






FAQs for Safety Performance
Track your TRIR first - that's your incident rate normalized by hours worked. Most useful metric hands down. Also grab near-miss frequency and days away from injuries. Here's the thing though - everyone gets obsessed with what already happened instead of preventing it. Leading indicators like training completion rates and hazard reports are way smarter. They catch problems before someone gets hurt. Oh, and don't forget severity rates so you know how bad incidents actually are when they do happen. Start simple with TRIR and near-miss reporting if you're just getting this going.
Get a solid data collection system going first - monthly or quarterly check-ins usually work well. Automated dashboards are your friend here (trust me, manual spreadsheets will make you want to quit). Pick 3-5 key metrics like incident rates and near misses instead of tracking every little thing. Here's where it gets interesting though - you want to look at trends next to stuff like staffing changes or busy seasons. That's when patterns actually start making sense. Start collecting your baseline data now, then review the trends at safety meetings. Way easier to catch problems early that way.
Hey, so training metrics are basically crystal balls for safety - they show you problems before people get hurt. Track completion rates, when someone last did their refresher training, and quiz scores to see if stuff actually stuck. Most places just obsess over injury numbers after the damage is done, which honestly drives me crazy. Your incident rates will tank if people aren't trained properly or their certs are ancient. Start with an audit of who's current on certifications. Build some dashboards around those percentages and you'll spot gaps way earlier.
Look at your injury data from the last few years first - that's where you'll find the real patterns. Construction companies should track falls, near-misses, and equipment inspections because that's what's actually dangerous on site. Healthcare is completely different though - they focus on needle sticks, patient lifting injuries, infection rates. Honestly, every industry has its own nightmare scenarios. The trick is figuring out what specifically hurts people in YOUR workplace, then measuring around preventing those exact things. Don't just copy what other companies do - your risks are probably way different than theirs.
Honestly, the biggest mistake is only tracking injury rates - that's like looking in the rearview mirror. Mix in some leading indicators too, like near-miss reports or safety training completion. Don't go overboard with metrics either. I've seen companies track 20+ KPIs and nobody pays attention to any of them. Pick 3-5 that actually matter. Your frontline people need to get how their daily work connects to these numbers, otherwise what's the point? Some important safety stuff is hard to measure, but don't just default to counting the easy things.
Look, forget those monthly reports - they're basically useless by the time you see them. Get some IoT sensors tracking stuff automatically, plus mobile apps so people can report incidents right away. Real-time dashboards are where it's at. AI's pretty solid at catching patterns you'd totally miss and flagging problems before they blow up. The trick is connecting everything so you're not juggling five different data sources (been there, it sucks). I'd start with your most important metrics first, then expand once you've got those dialed in.
Here's what I've seen - better safety numbers usually mean better business results overall. Fewer accidents = less downtime and cheaper insurance, plus people actually want to work there. Companies with solid safety records tend to just run tighter operations in general, honestly. The numbers back this up too - top safety performers beat their competitors financially by like 20-30%. Pretty crazy difference. Oh, and don't just track injury rates after stuff happens. You'll want to watch the early warning signs - near misses, training completions, that kind of thing. Way more useful for actually preventing problems.
Honestly, safety KPIs work because they show your team you actually give a damn about them staying in one piece. Tracking near-misses and incident rates creates this psychological safety thing - people know you've got their back. Way better than just obsessing over sales numbers, right? When you celebrate safety milestones, it gives everyone something positive to get excited about. Plus your team won't be constantly worried about getting hurt, which is huge for morale. I'd start sharing those safety dashboards monthly. You'll probably see engagement scores climb right alongside your safety improvements.
Just build safety metrics right into your regular performance reviews. Pick 2-3 things like incident rates, near-miss reports, or safety training completion. Most people only think about safety when someone gets hurt, which is backwards honestly. Make it part of their development goals and tie it to promotions or recognition. I'd start small - don't overwhelm everyone with a million metrics. Regular check-ins help way more than you'd think. The whole point is showing people that safety actually matters for their career, not just something HR talks about. Once it's visible in reviews, people pay attention.
Track both types of metrics - the stuff that predicts problems and what already went wrong. Leading ones are training completion, near-miss reports, audit scores. Those help catch issues early. Lagging metrics? Injury rates, lost time, comp claims. Honestly, near-miss reports are pure gold if your people actually bother filling them out right. Also measure engagement through surveys and meeting participation - that matters more than you'd think. The trick is balancing both types. Lagging tells you what happened, but leading indicators let you fix things before they blow up.
Absolutely get your frontline people involved - they're literally the ones seeing what's dangerous every day. I'd start with some focus groups or safety committees where they can tell you what actually matters for tracking. Management sitting in boardrooms usually misses the real stuff happening out there, you know? Ask what near-misses they're noticing, which behaviors need monitoring, how they'd define "success." Their input makes the whole thing more relevant. Plus you'll get way better buy-in when people help create what they're measured on. Maybe kick it off with a quick survey first to see what ideas come up.
Dude, near-miss reports are honestly so valuable for safety metrics. Instead of waiting around for people to get hurt, you're getting early warning signs. Track stuff like reporting rates and how fast you resolve issues - oh, and here's something weird: when report numbers go up, that's actually good news since it means people feel comfortable speaking up. You can spot hazards before they blow up into real incidents. The near-miss to actual incident ratio? That's where the magic happens. Way better than just measuring injuries after the fact.
So benchmarking basically stops you from just making up random safety goals. You can actually see how you stack up against other companies in your industry - whether you're crushing it or need serious help. Trade associations usually publish this stuff, which is way better than comparing yourself to some totally different business. Your team won't think you're completely delusional when you set targets either. I mean, nobody wants to sit through another eye-roll meeting where the goals make zero sense. It's honestly like having directions instead of wandering around blind with your safety performance.
Honestly, the biggest thing is giving specific people ownership - no more "everyone's responsible so nobody's responsible" BS. Pick 2-3 metrics max, don't try tracking everything at once. Monthly sit-downs where managers actually talk through their data work way better than those useless email updates. I swear, half the safety meetings I've been in are just people nodding along saying "yep, all good here." Be upfront about what happens when people hit targets vs. miss them. Recognition's great, but you need real consequences too or it's just theater.
So compliance is basically your starting point for safety KPIs. You gotta track stuff that shows you're hitting legal requirements - OSHA standards, environmental regs, whatever applies to your industry. We're talking incident rates, audit scores, training completion percentages. Once you figure out which regulations actually matter for your operation, build your KPIs around what those rules want you to measure. It's pretty simple when you think about it that way. Your metrics become proof you're not just going through the motions but actually keeping up with what regulators expect. Honestly beats scrambling during an inspection.
-
SlideTeam’s readymade presentations have landed my unique images with my bosses in the past and it continues to reward me.
-
My team has been relying on SlideTeam’s professional PPT designs for a while now. It has greatly sped up quality work at my organization. So thanks!