


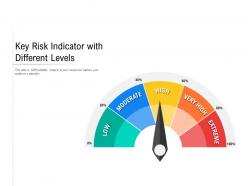
Key risk indicator with different levels





Try Before you Buy Download Free Sample Product
 Impress Your
 Audience
 100%
100% Editable
 Save Hours
 of Time


Our Key Risk Indicator With Different Levels are topically designed to provide an attractive backdrop to any subject. Use them to look like a presentation pro.
People who downloaded this PowerPoint presentation also viewed the following :
Key risk indicator with different levels with all 2 slides:
Use our Key Risk Indicator With Different Levels to effectively help you save your valuable time. They are readymade to fit into any presentation structure.
FAQs for Key risk indicator
Think of KRI levels like warning lights on your car dashboard. Green means all good, yellow tells you to start paying attention, red screams "deal with this NOW." Without these thresholds, you're just guessing when risks actually matter - which honestly never works out well. Short punchy ones work best. Base your levels on what your company can actually handle, not some textbook example that looks neat in a presentation. It's way better than scrambling to figure out if something's actually dangerous when you're already stressed about it.
Start with your historical data to figure out what's actually normal for your situation. Set your thresholds using standard deviations or percentiles from that baseline. Green zone = you're comfortable, yellow = getting sketchy, red = oh shit territory. Your risk tolerance matters here too - some people freak out earlier than others. Get input from different departments since they know the day-to-day reality better than anyone. Honestly though? Don't overthink the perfect setup right away. You can tweak thresholds later once you see how things actually play out. It's messy at first but gets cleaner with real data.
Honestly, data quality makes or breaks your KRIs - garbage in, garbage out. Bad data means your thresholds are basically useless. You'll get false alerts constantly, which kills everyone's trust in the system pretty fast. Clean, current data is what actually makes those green/amber/red levels mean something real. Missing genuine risks or constantly crying wolf - both scenarios suck equally. Set up data validation checks first, get your data governance sorted out. I know it's boring groundwork, but don't even bother tweaking thresholds until your data inputs are solid.
Check your KRI levels quarterly minimum, but honestly that's pretty conservative. Fast-changing stuff needs monthly reviews. Match your schedule to how quick your business actually moves - stable industry? Quarterly's fine. Dealing with crazy regulations or volatile markets? Way more often. I've watched teams do annual reviews (terrible idea) and completely miss major shifts that made their thresholds useless. Oh, and set actual calendar reminders - treat it like changing your car's oil or whatever. When those KRIs catch problems early, you'll be so glad you stayed on top of it.
Honestly, start with your operational systems and transaction logs - that's where the real-time stuff lives. Financial data from your general ledger and trade systems is obviously critical too. Market feeds and regulatory databases give you the external view you need. Don't forget the messy human stuff though - incident reports and audit findings tell you what actually went wrong, not just what the numbers show. I always tell people to map out which systems actually capture the events behind your risks first. Makes the whole thing way less overwhelming. Oh, and make sure whatever data you're pulling is actually current and reflects reality.
Honestly, AI can be a game-changer for KRI monitoring. You'll get real-time alerts instead of waiting around for monthly reports. The technology spots patterns you'd totally miss doing it manually – which, let's be real, nobody has time for anyway. It even predicts potential issues before they blow up by learning from your historical data. Pretty wild stuff. You can monitor hundreds of KRIs at once through automated dashboards that only bug you about the stuff that actually matters. My advice? Pick your most critical KRIs first and test out a monitoring tool on those.
Don't set your levels stupidly close together - like 85%, 90%, 95%. What's even the point of that? Actually talk to the people getting pinged at 3am before you decide anything. Historical averages are pretty useless if your business changed dramatically last year. I see people pick thresholds that sound clean and neat instead of what actually matters for their risk tolerance. Oh, and run some fake scenarios first! You don't want to find out your alerts are broken during a real incident. Start wide between levels, then tighten based on feedback.
So basically you gotta connect your KRI thresholds straight to whatever risk appetite you've already set up. Find which indicators actually matter for each risk area first. Then do the math - if you can tolerate 5% operational losses, set your yellow flag at like 3-4% so you're not scrambling at the last second. Green/yellow/red thresholds should make sense and give you breathing room. Honestly, half the time the numbers don't even add up when you check (happens more than you'd think). Review them every quarter or you'll drift off course. The whole thing falls apart if your thresholds don't actually reflect what you said you could handle.
Dude, you absolutely have to get everyone on the same page about what those KRI numbers actually mean. Finance will look at a yellow alert and do one thing, while IT freaks out and does the complete opposite - I've watched this trainwreck happen so many times. Don't just blast out generic reports expecting people to figure it out. Each team needs to know what their specific triggers are and exactly how they should react. Honestly, half the battle is just translating risk-speak into language they'll actually understand instead of leaving everyone scratching their heads.
Think of KRIs like your car's warning lights - they should tell you exactly what to do next. Set up three levels: green, amber, red. When something hits amber, maybe you start checking twice as often. Red means you're calling the boss immediately, no questions asked. The trick is deciding these actions beforehand so nobody's standing around going "uh, now what?" Honestly, most teams mess this up by just tracking numbers without connecting them to actual decisions. Each threshold needs a clear owner too - someone who knows it's their job to act when things go sideways.
Honestly, it varies by industry but there are definitely patterns. Financial companies obsess over credit loss ratios and liquidity coverage. Manufacturing? They're all about equipment downtime and defect rates. Healthcare tracks patient safety stuff and readmission rates religiously. Tech companies are probably the worst - they monitor system uptime, security breaches, data recovery times... I swear they have metrics for their metrics at this point! But here's the thing: pick 3-5 indicators that actually warn you before disasters hit, not ones that just confirm what already went wrong. Figure out your worst-case scenarios first, then find the early warning signs.
So regulatory requirements are basically your floor - like capital ratios, liquidity coverage, that stuff. Regulators tell you pretty clearly what amber and red zones look like for most metrics. Don't just copy their limits though (seen way too many teams do this). Set your internal thresholds tighter so you get early warning before actually hitting compliance problems. Map out what regulations you're dealing with first, then work backwards to figure out when you want alerts going off. Honestly, the whole point is catching issues before regulators do.
Link your KRI levels to actual response actions - think "if this happens, then we do that." Don't just set pretty red/yellow/green numbers. Define who does what when each threshold gets hit. Honestly, most KRI dashboards I've seen are glorified screensavers because nobody knows how to react when the alerts go off. You'll want clear escalation paths that everyone can follow immediately. Test these response plans regularly too - sometimes what looks good on paper falls apart in real life. Update your thresholds based on what actually works, not what sounds smart in meetings.
Look, KRI levels are basically your early warning system - way better than finding out about problems when everything's already falling apart. You set thresholds so you can catch risks while they're still manageable instead of playing firefighter later. Honestly, quarterly reviews are clutch for making sure your thresholds actually mean something. The data helps you see patterns too, which is pretty useful for figuring out what your organization can actually handle risk-wise. Short version: prioritize the scary stuff, monitor the rest, and you'll save yourself a ton of headaches.
Make your KRI training super hands-on with real scenarios they'll actually encounter. Skip the theory stuff - have them work through your actual dashboards and practice what each threshold means. Role-playing helps too (sounds cheesy but it works). Connect every KRI level to clear response steps so nobody's guessing when things go sideways. Oh, and definitely run simulations before anyone needs to handle the real deal under pressure. People learn way better when they can mess up in a safe space first. Just don't forget to update the training when your KRIs change.
No Reviews