Sales process map ppt examples

Rating:
90%
Slide 1 of 5

or

Favourites Favourites

Try Before you Buy Download Free Sample Product

Audience Impress Your
Audience
Editable 100%
Editable
Time Save Hours
of Time
The Biggest Sale is ending soon in
0
0
:
0
0
:
0
0
Rating:
90%
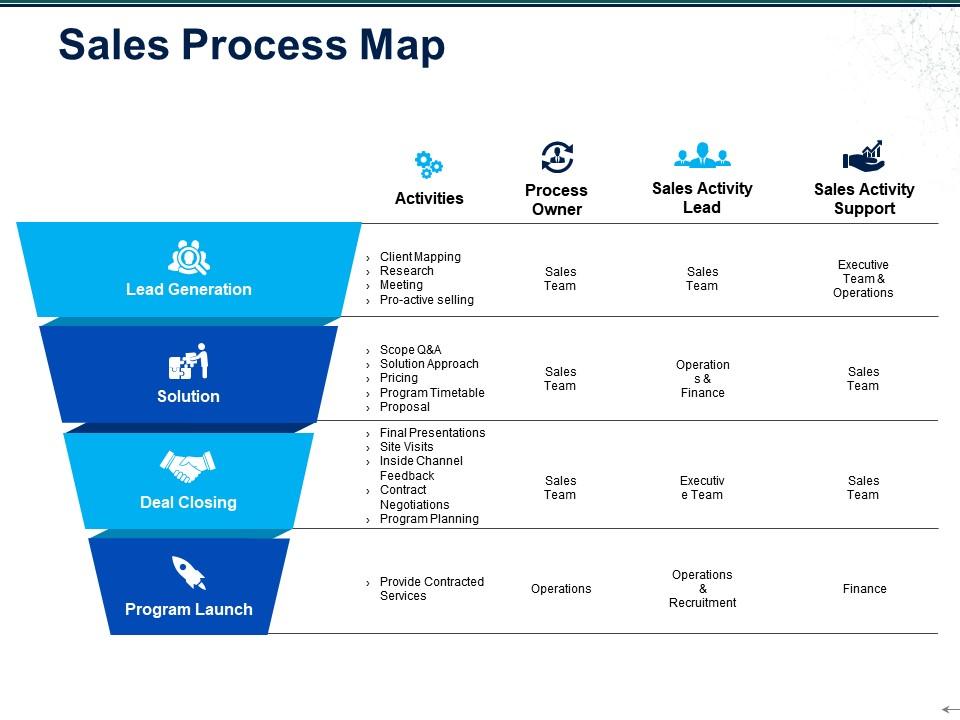
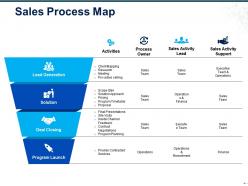
Presenting this set of slides with name - Sales Process Map Ppt Examples. This is a four stage process. The stages in this process are Lead Generation, Solution, Deal Closing, Program Launch.

People who downloaded this PowerPoint presentation also viewed the following :

FAQs for Sales process

An effective sales process map includes lead generation, prospect qualification, needs assessment, solution presentation, objection handling, negotiation, and deal closure. These stages streamline customer interactions by establishing clear touchpoints, standardizing follow-up procedures, and tracking conversion metrics, with many organizations finding that structured processes ultimately deliver shorter sales cycles and higher win rates.

Visualizing the sales process improves team performance by identifying bottlenecks, standardizing best practices, and creating accountability across each stage. Through clear process maps, sales teams can streamline lead qualification, accelerate deal progression, and enhance collaboration between marketing and sales departments, ultimately delivering shorter sales cycles and higher conversion rates.

**INPUT**: What tools are commonly used to create a sales process map? **OUTPUT**: Sales process mapping tools include Microsoft Visio, Lucidchart, Salesforce Process Builder, Creately, and Draw.io for visual workflow creation. These platforms streamline mapping by offering drag-and-drop functionality, collaboration features, and CRM integration, with many organizations finding that visual mapping tools enhance team alignment, identify bottlenecks faster, and ultimately deliver more efficient sales operations. [Word count: 56 words]

B2B sales process maps typically feature longer cycles with multiple stakeholders, formal approval stages, and relationship-building phases, while B2C maps emphasize shorter, more transactional pathways focused on individual decision-makers. B2B organizations often require detailed lead qualification, proposal development, and contract negotiation stages, whereas B2C companies streamline checkout processes and immediate purchase conversions, ultimately delivering different customer experiences.

Key metrics include lead conversion rates, average deal size, sales cycle length, pipeline velocity, and win/loss ratios at each stage. These metrics enhance sales performance by identifying bottlenecks, optimizing resource allocation, and improving forecasting accuracy, with many organizations finding that systematic tracking ultimately delivers higher conversion rates and more predictable revenue growth.

Buyer personas influence sales process map development by defining customer journey stages, pain points, decision-making criteria, and communication preferences at each touchpoint. These insights enable sales teams to customize messaging, select appropriate channels, and design targeted interventions, with many organizations finding that persona-driven mapping increases conversion rates and shortens sales cycles significantly.

Data analytics plays a crucial role in refining sales process maps by identifying bottlenecks, measuring conversion rates at each stage, tracking customer behavior patterns, and revealing performance gaps across different sales channels. Through predictive analytics and real-time dashboards, organizations can optimize their sales workflows, reduce cycle times, and enhance lead qualification processes, ultimately delivering improved conversion rates and more strategic resource allocation.

A sales process map helps identify bottlenecks by visualizing each stage of the sales funnel, revealing where prospects stall, drop off, or experience delays in progression. This strategic mapping enables sales teams to pinpoint inefficiencies, streamline workflows, and optimize resource allocation, with many organizations finding that clear visualization ultimately delivers faster conversion rates and improved sales performance.

Including feedback loops in sales process maps enables continuous improvement, enhanced customer relationships, better forecasting accuracy, increased conversion rates, and streamlined team collaboration. These mechanisms help sales teams identify bottlenecks, refine messaging strategies, and adapt approaches based on real-time insights, with many organizations finding that systematic feedback integration ultimately delivers higher revenue performance and competitive advantage.

Sales process maps should be reviewed quarterly and updated whenever significant changes occur in market conditions, customer behavior, technology adoption, or team performance metrics. Regular quarterly reviews enable organizations to identify bottlenecks, optimize conversion rates, and adapt to evolving buyer preferences, while major updates following product launches, competitive shifts, or CRM implementations ensure continued alignment with business objectives and market realities.

Common pitfalls include overcomplicating the process with unnecessary steps, failing to involve sales team input, creating rigid workflows that don't accommodate customer variations, and neglecting regular updates as markets evolve. These oversights often result in reduced adoption rates, decreased sales efficiency, and missed opportunities, with many organizations finding that simplified, flexible mapping approaches ultimately deliver better team buy-in and improved conversion rates.

A sales process map enhances CRM by standardizing customer interactions, tracking touchpoints throughout the buyer journey, and identifying opportunities for personalized engagement at each stage. This systematic approach enables sales teams to deliver consistent experiences, prioritize follow-ups more effectively, and leverage CRM data strategically, ultimately strengthening customer relationships and increasing retention rates.

Sales process maps should include clear stage definitions, specific actions required at each step, decision points with criteria, timeline expectations, and designated responsibilities. These elements streamline sales operations by establishing accountability, reducing cycle times, and improving conversion rates, with many organizations finding that detailed process maps ultimately enhance team performance and revenue predictability.

Cross-functional collaboration enhances sales process maps by incorporating diverse perspectives from marketing, customer service, finance, and operations teams, ensuring comprehensive workflow alignment and identifying bottlenecks across departments. This strategic integration streamlines handoffs, improves lead qualification accuracy, and accelerates deal closure rates, with many organizations finding that collaborative mapping ultimately delivers enhanced customer experiences and increased revenue conversion.

A well-defined sales process map significantly improves lead conversion rates by providing clear stages, consistent follow-up protocols, and standardized qualification criteria that prevent prospects from falling through cracks. Through systematic tracking and defined touchpoints, organizations streamline sales activities, reduce cycle times, and enhance customer interactions, with many companies finding that structured processes increase conversion rates by 20-30% while delivering predictable revenue growth.

Ratings and Reviews

90% of 100
Review Form
Write a review
Most Relevant Reviews
  1. 80%

    by Brown Murphy

    Wonderful templates design to use in business meetings.
  2. 100%

    by Coy Wallace

    Great experience, I would definitely use your services further.

2 Item(s)

per page: