


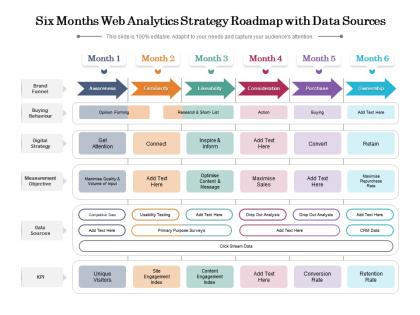
Six months web analytics strategy roadmap with data sources




Try Before you Buy Download Free Sample Product
 Impress Your
 Audience
 100%
100% Editable
 Save Hours
 of Time


The success rate of business plans is hugely dependent on the plan of action, and this editable Six Months Web Analytics Strategy Roadmap With Data Sources rightly serves the purpose. Encapsulate all the information related to the project in a well structured manner to obtain maximum efficiency by incorporating our stunning PowerPoint theme. State the critical deliverable, steps involved, time frame, workforce allocation, and lots more in an easy to understand manner by utilizing this pre designed roadmap PowerPoint layout. You can also prioritize your tasks and discuss the problem areas with your colleagues by incorporating this tailor made PPT layout. Empower your work plan by employing this professionally designed PPT theme. Entrepreneurs can download Six Months Web Analytics Strategy Roadmap With Data Sources as a beneficial communication tool that facilitates in collaborating with different tasks and achieve targets.
People who downloaded this PowerPoint presentation also viewed the following :
Six months web analytics strategy roadmap with data sources with all 2 slides:
Use our Six Months Web Analytics Strategy Roadmap With Data Sources to effectively help you save your valuable time. They are readymade to fit into any presentation structure.
FAQs for Six months web analytics strategy roadmap
Honestly, don't get caught up in vanity metrics like traffic - I made that mistake early on. Focus on what actually makes you money: conversion rates, customer acquisition costs, and lifetime value. Those are your bread and butter. Bounce rate and time on page will tell you if people actually like what they're seeing or just bouncing immediately. For e-commerce, revenue per visitor is gold. I'd stick to maybe 5 core metrics at first. You can always dig deeper later, but too many numbers upfront just makes everything confusing.
Look, your user data is basically everything when it comes to design decisions. Say your analytics show mostly 18-25 year olds on mobile - you'd go mobile-first with short content and lots of visuals. We made this mistake once assuming our B2B users were all tech nerds like us. Spoiler: they weren't. Older users actually want bigger fonts and way more detail. Device usage, age, location - check all that stuff regularly. Then A/B test your changes against those specific groups to see what actually works. It's kind of obvious but so many people skip this step.
A/B testing stops you from just guessing what went wrong with your site. You can actually test two versions of a page and see which one converts better - way better than trying to decode why your numbers tanked last month. The data gets so much cleaner because you're controlling what changes. Instead of some vague "bounce rate went up," you get concrete stuff like "red button beat blue button by 15%." Honestly, it's addictive once you start seeing results. Just test one thing at a time though, or you won't know what actually moved the needle. Hit your busiest pages first.
So behavioral analytics is clutch because it shows what users actually do, not what they claim in surveys. You'll see the real paths people take through your site - and trust me, some routes to checkout are absolutely bizarre. It reveals where folks bail out and helps you spot friction you didn't even know existed. The best part? You can figure out which stages are bleeding the most customers or cash, so you know what to fix first. Way better than guessing what's broken in your funnel.
Start with Google Analytics - it's free and handles most of your traffic and conversion tracking. Google Tag Manager is a lifesaver too since you won't have to bother developers every time you need to add tracking code. Hotjar's pretty solid for heatmaps if you want to see how people actually use your site. Don't forget your Facebook Pixel and Google Ads tracking if you're doing paid stuff. Honestly though? Just GA and GTM will cover like 80% of what you need. I'd set up your goals and events first before getting distracted by all the shiny tools out there.
First thing - connect your KPIs straight to what you're actually trying to achieve. Revenue growth? Track conversion rates and order values, not just website visitors. Pick maybe 3-5 metrics tops because I've seen teams drown in data way too many times. Different people care about different numbers too - marketing loves lead quality while sales obsesses over conversions. Set targets you can actually hit based on where you're at now. Oh, and make sure these metrics will actually change how your team operates. Otherwise what's the point? Review them every few months to stay on track.
Dude, mobile analytics is a game changer for your site performance. Most of your traffic is probably mobile anyway - like 60% or more. Without tracking it properly, you're missing huge chunks of user behavior data. Load times hit different on mobile, bounce rates are weird, and people navigate totally differently than on desktop. I learned this the hard way when my conversion rates were trash and I couldn't figure out why. Turns out mobile users were bouncing at checkout because the form was impossible to use on phones. Set up mobile-specific goals in your analytics and compare those conversion funnels between devices. You'll be surprised how different they are.
Check your analytics for pages getting decent traffic but crazy high bounce rates - those need help first. Your organic search queries will blow your mind honestly, people search for the weirdest stuff compared to what you'd expect. Pages ranking well but getting ignored in search results? Your meta descriptions probably suck. I'd also peek at how people move through your site from main landing pages - shows you exactly where they bail. Oh, and definitely tackle your biggest traffic pages with the worst problems first since that's where you'll see the most impact.
Don't fall for the classic trap of thinking correlation equals causation - two things moving together doesn't mean one caused the other. Also, vanity metrics are the worst. Page views might look cool but mean nothing if people aren't actually buying anything. Make sure you've got enough data before making big decisions (I learned this one the hard way). Segment everything instead of relying on averages - mobile users act completely different from desktop ones. Oh, and figure out what "success" actually looks like for your business first. Otherwise you're just staring at pretty charts that don't tell you anything useful.
Definitely get consent before you start tracking people - that's the big one. Anonymize IP addresses too. GDPR and CCPA compliance isn't optional anymore, honestly it's just part of doing business online now. Your analytics should respect do-not-track requests and make opting out super easy. Only grab data you'll actually use for real business decisions, not just because you can. Oh and audit your retention policies every so often - you'd be surprised how much junk accumulates. I'd start with documenting what you're currently tracking, then work backwards from there.
Honestly, connecting website behavior to actual sales data changes everything. You'll finally see the real customer journey - not just guessing which ads work. Sales teams love getting context on leads beforehand too. The cool part? You catch high-value visitors way earlier and can personalize their experience. No more throwing money at traffic that never converts (been there, done that). Start with syncing email addresses between your platforms - it's usually the smoothest way to get going. Takes some setup but worth every minute.
Heatmaps are honestly game-changers for figuring out what users actually do on your site. Click maps show you those annoying dead zones where people tap but nothing happens - perfect spots for adding buttons or links. The scroll ones? They'll tell you exactly when people bail, so you can move your good stuff higher up. I always check the movement maps too since they show what catches eyes versus what gets totally ignored. Run them on your busiest pages for like a week minimum - you need decent data or it's kinda pointless. It's basically spying on user behavior, which sounds creepy but is super useful.
Honestly, you need a solid process that goes from "here's what we learned" to actually doing something about it. Pick metrics that matter to your business goals - skip the vanity stuff that just looks nice on reports. Set up regular meetings where you talk through what the data actually means, and make sure someone owns each action item. I swear, so many companies just pile on more dashboards but never change anything! Test one thing at a time so you can tell what's working. When you present findings, ditch the jargon and give people clear next steps. Numbers alone won't get you anywhere.
Dude, seasonal trends will absolutely wreck your analytics if you don't see them coming. Traffic and conversions swing wildly based on holidays, weather, back-to-school stuff - you know the drill. E-commerce gets slammed during Black Friday then basically dies in January. Here's what actually works: compare year-over-year instead of month-to-month so you can tell real growth from seasonal weirdness. I always set up separate dashboards for seasonal vs normal performance. Custom date ranges are your friend here. That way you won't freak out when traffic tanks during slow periods that happen every single year.
Look, here's the thing about audience segments - they show you what's really happening behind those misleading averages. Your bounce rate might look terrible at 65% overall, but break it down and you'll see mobile users are at 45% while desktop hits 80%. That's a completely different story, right? Same with conversions - knowing your overall rate is 3% is pretty useless compared to seeing that returning customers convert at 8% while new visitors barely hit 1%. Each group acts totally different and needs its own approach. I'd start with the basics: traffic sources, device types, new vs returning visitors. Trust me, you'll actually understand what's going on then.
No Reviews