


Six sigma process improvement powerpoint presentation with slides





Try Before you Buy Download Free Sample Product
 Impress Your
 Audience
 100%
100% Editable
 Save Hours
 of Time


As a company owner you know that bringing a lean process approach is tricky. Here our PowerPoint slide deck can prove handy. You can use this six sigma process improvements complete PowerPoint show to share insights about six sigma tools, techniques and six sigma methodology required for process improvement. Furthermore, to completely revamp a supply chain management system our presentation deck helps to motivate employees for better time management and reduce cycle time. Not only this; with our six sigma improvement model PPT example you can bring a continuous improvement or quality management culture in your company so as to enhance customer satisfaction and loyalty. Big picture here is that exclusive presentation slides like why six sigma, the dmaic process, kano analysis, process mapping flow charting, value stream map etc. makes our visual show an exceptional one crafted to minimize defects in business processes. In short, now you have all that you want to kick start a six sigma process PPT presentation. So what are you thinking now? Just click and download. Arouse that fire in their bellies with our Six Sigma Process Improvement Complete Powerpoint Deck With Slides. It will ignite ambitions.
People who downloaded this PowerPoint presentation also viewed the following :
Content of this Powerpoint Presentation
Slide 1: This slide introduces Six Sigma Process Improvement. State Your Company Name and get started.
Slide 2: This is an Agenda slide. State your agendas here.
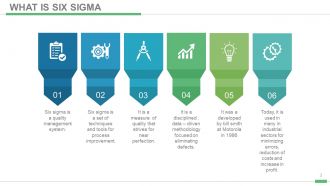
Slide 3: This slide showcases What is Six Sigma with the following content- Six sigma is a quality management system. Six sigma is a set of techniques and tools for process improvement. It is a measure of quality that strives for near perfection. It is a disciplined , data – driven methodology focused on eliminating defects. It was a developed by bill smith at Motorola in 1986 To day, it is used in many in industrial sectors for minimizing errors, reduction of costs and increase in profit
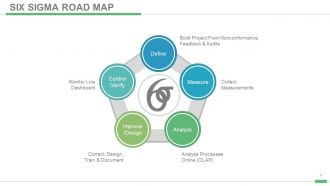
Slide 4: This slide shows a Six Sigma Road map with the following subheadings- Build Project From Non-conformance, Feedback & Audits, Monitor Live Dashboard, Collect Measurements, Correct, Design, Train & Document, Analyze Processes Online (OLAP) as Define, Measure, Analyze, Improve/Design, Control/Verify.
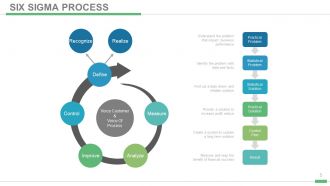
Slide 5: This slide presents the Six Sigma Process with the following content- Practical Problem: Understand the problem that impact business performance. Statistical Problem: Identify the problem with data and facts Statistical Solution: Find out a data driven and reliable solution Practical Solution: Provide a solution to increase profit reduce Control Plan: Create a system to sustain a long term solution Result: Measure and reap the benefit of financial success as Recognize, Realize, Measure, Analyze, Control, Improve, Define, Voice Customer, & Voice Of Process.
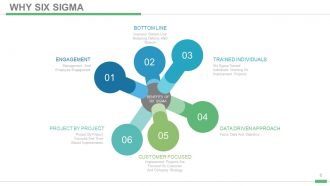
Slide 6: This slide shows WHY SIX SIGMA with the following subheading Benefits Of Six Sigma divided into- Customer Focused, Data Driven Approach, Bottom Line, Engagement, Trained Individuals, Project By Project.
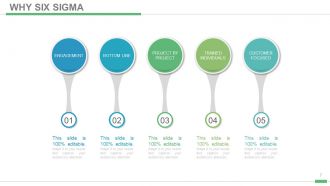
Slide 7: This slide shows WHY SIX SIGMA with the following subheadings- Customer Focused, Data Driven Approach, Bottom Line, Engagement, Trained Individuals, Project By Project.
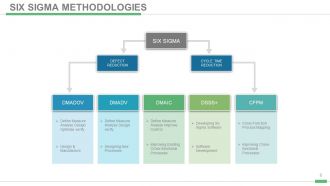
Slide 8: This slide shows Six Sigma Methodologies showing- Defect Reduction, Cycle Time Reduction, CFPM, DSSS+ DMAIC, DMADV, DMADOV, Design & Manufacture, Designing New Processes, Improving Existing Cross-functional Processes, Software Development, Improving Cross-functional Processes, Cross Function Process Mapping, Developing Six Sigma Software, Define Measure Analyze Design Verify, Define Measure Analyze Design Optimize Verify, Define Measure Analyze Improve Control.
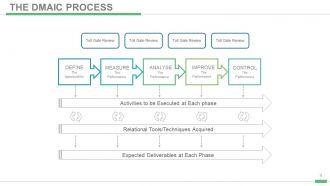
Slide 9: This slide showcases the DMAIC Process showcasing- Relational Tools/Techniques Acquired Expected Deliverables at Each Phase Activities To Be Executed At Each Phase DEFINE: The opportunities MEASURE: The Performance ANALYSE: The Performance IMPROVE: The Performance CONTROL: The Performance and Toll Gate Review.
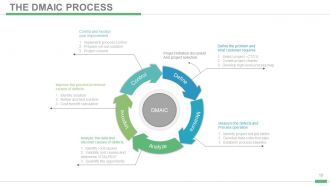
Slide 10: This slide presents The DMAIC Process showing- Project initiation document And project selection Define The Problem And What Customer Requires 1. SELECT PROJECT –CTO’S 2. CREATE PROJECT CHARTER 3. DEVELOP HIGH-LEVEL PROCESS MAP Measure The Defects And Process Operation 1. IDENTIFY PROJECT OUT PUT METRIC 2. DEVELOP DATA COLLECTION PLAN 3. ESTABLISH PROCESS BASELINE Analyze The Data And Discover Causes Of Defects 1. IDENTIFY ROOT CAUSES 2. VALIDATE ROOT CAUSES AND DETERMINE..VITALFEW’’ 3. QUANTIFY THE OPPORTUNITY Improve The Process To Remove Causes Of Defects 1. IDENTIFY SOLUTION 2. REFINE AND TEST SOLUTION 3. COST BENEFIT CALCULATION Control And Monitor Your Improvement 1. IMPLEMENT PROCESS CONTROL 2. PREPARE ROLL-OUT SOLUTION 3. PROJECT CLOSURE Define, Measure, Analyze, improve, Control.
Slide 11: This slide elaborates STEP 1: DEFINE.
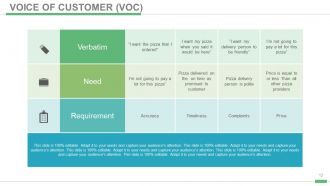
Slide 12: This slide presents the Voice Of Customer with- Need, Requirement, Verbatim.
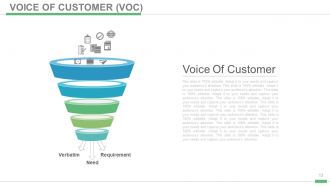
Slide 13: This slide showcases VOICE OF CUSTOMER (VOC) in funnel form.
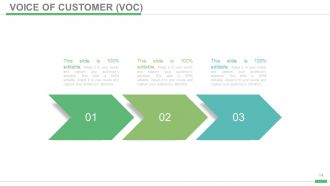
Slide 14: This slide showcases VOICE OF CUSTOMER (VOC) in arrow form.
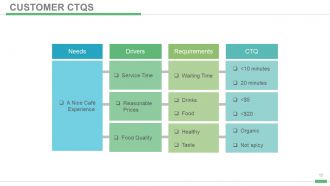
Slide 15: This slide showcases Customer CTQs in hierarchy form displaying- REQUIREMENTS, CTQ, DRIVERS, NEEDS.
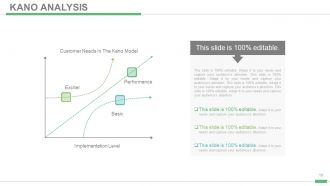
Slide 16: This slide showcases Kano Analysis with- Exciter, Performance, Basic, Customer Needs In The Kano Model, Implementation Level.
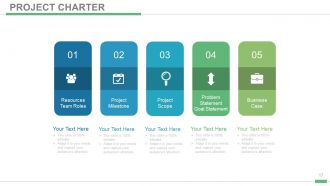
Slide 17: This slide showcases Project Charter displaying- Resources, Team Roles, Project, Milestone, Project Scope, Problem, Statement, Goal Statement, Business Case.
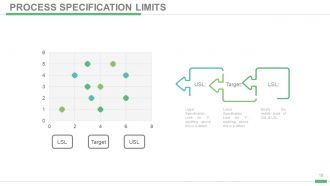
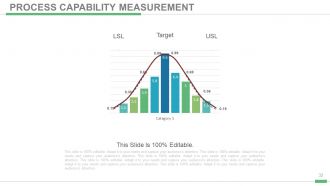
Slide 18: This slide showcases Process Specification Limits showing- LSL USL Target USL: Upper Specification Limit for ‘Y’, anything above this is a defect. Target: Lower Specification Limit for ‘Y’, anything above this is a defect.. LSL: Ideally the middle point of USL & LSL in bubble chart form.
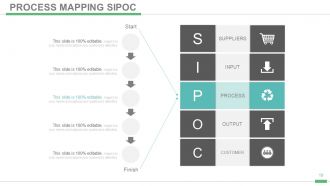
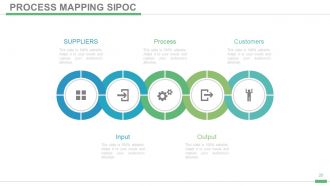
Slide 19: This slide showcases Process Mapping SIPOC with- C-CUSTOMER, O-OUTPUT, P-PROCESS, I-INPUT, S-SUPPLIERS.
Slide 20: This slide showcases Suppliers, Process, Customers, Output, Input.
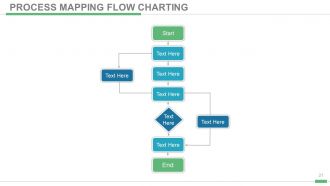
Slide 21: This slide shows Process Mapping Flow Charting.
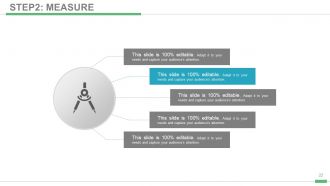
Slide 22: This slide showcases STEP 2: MEASURE.
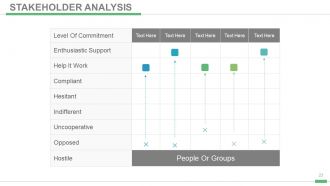
Slide 23: This slide shows Stakeholder Analysis in tabular form.
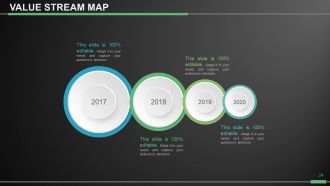
Slide 24: This slide showcases a Value Stream Map.
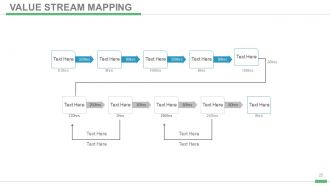
Slide 25: This slide also presents Value Stream Mapping.
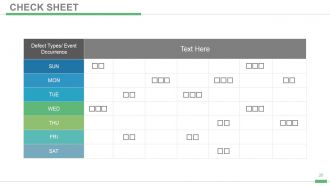
Slide 26: This is a CHECK SHEET slide in tabular form.
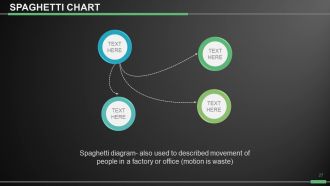
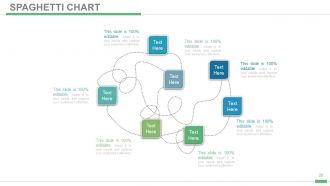
Slide 27: This slide displays a Spaghetti Chart diagram- also used to described movement of people in a factory or office (motion is waste)
Slide 28: This slide displays a Spaghetti Chart.
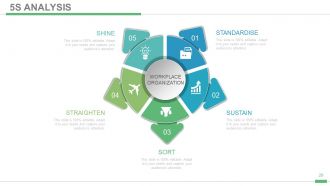
Slide 29: This slide shows 5S ANALYSIS namely- STRAIGHTEN, SORT, SHINE, SUSTAIN, STANDARDISE.
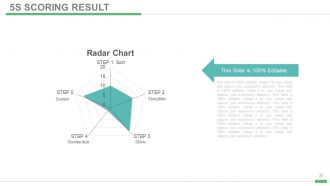
Slide 30: This slide shows 5S SCORING RESULT namely- Sustain, Straighten, Shine, Standardize.
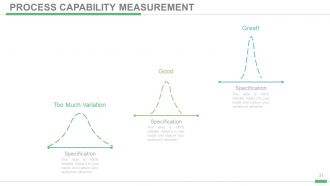
Slide 31: This slide shows Process Capability Measurement in crest graph form.
Slide 32: This slide also shows Process Capability Measurement in crest graph form displaying LSL, USL and TARGET.
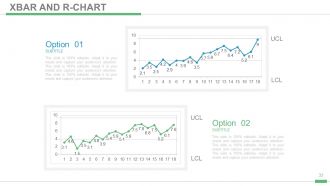
Slide 33: This slide showcases a XBAR AND R-CHART for presenting monitored variable data.
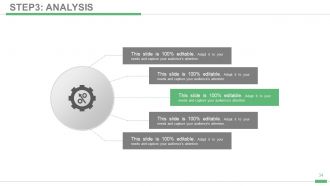
Slide 34: This slide displays STEP 3: ANALYSIS.
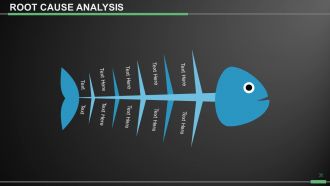
Slide 35: This slide shows Root Cause Analysis diagram.
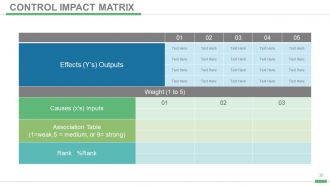
Slide 36: This slide shows a CONTROL IMPACT MATRIX.
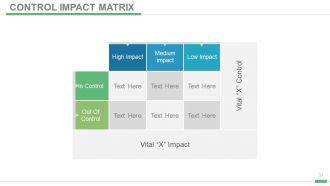
Slide 37: This slide also shows a CONTROL IMPACT MATRIX.
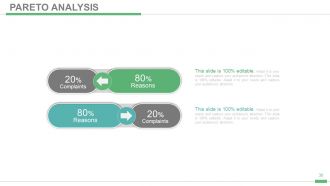
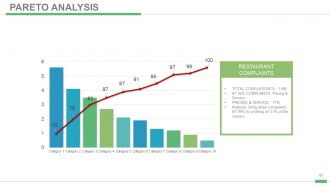
Slide 38: This slide displays Pareto Analysis.
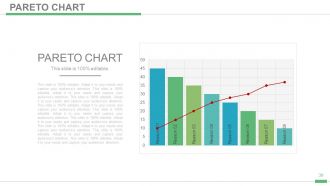
Slide 39: This slide displays Pareto Chart Analysis in graph form.
Slide 40: This slide also displays Pareto Analysis in graph form.
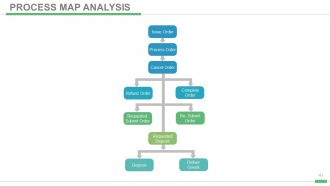
Slide 41: This slide shows PROCESS MAP ANALYSIS displaying- Issue order, Cancel order, Deliver Goods, Process order, Refund order, Requested- submit order, Requested Deposit, Complete order, Re- submit order, Deposit.
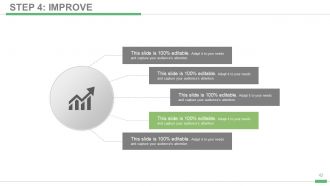
Slide 42: This slide shows STEP 4: IMPROVE.
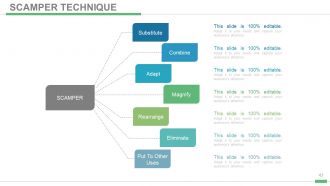
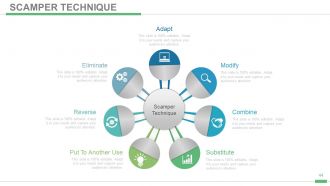
Slide 43: This slide displays the SCAMPER TECHNIQUE- Substitute Combine Adapt Magnify Rearrange Eliminate Put To Other Uses.
Slide 44: This slide displays the Scamper Technique showing- Reverse, Eliminate, Put To Another Use, Modify, Adapt, Combine, Substitute.
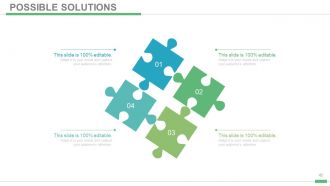
Slide 45: This slide is titled Possible Solutions in puzzle image form.
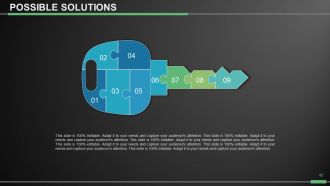
Slide 46: This slide is titled Possible Solutions in puzzle key image form.
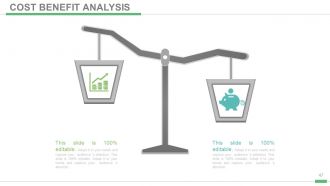
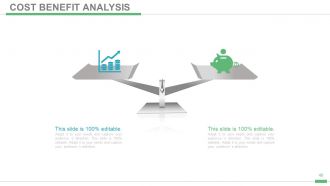
Slide 47: This slide shows Cost Benefit Analysis in balance image form.
Slide 48: This slide too shows Cost Benefit Analysis in balance image form.
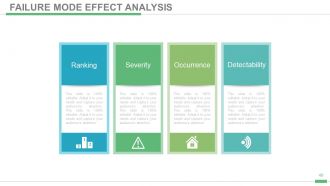
Slide 49: This slide showcases Failure Mode Effect Analysis displaying- Ranking, Severity, Occurrence, Detectability.
Slide 50: This slide shows STEP 5: CONTROL
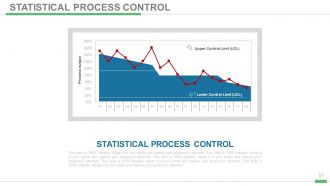
Slide 51: This slide shows Statistical Process Control displaying- Upper Control Limit (UCL), Lower Control Limit (UCL) with Process output.
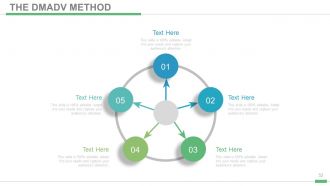
Slide 52: This slide presents The DMADV Method.
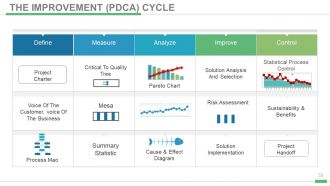
Slide 53: This slide elaborates The Improvement (PDCA) Cycle showcasing- Analyze: Pareto Chart, Cause & Effect Diagram. Improve: Solution Analysis And Selection, Solution Implementation, Risk Assessment. Control: Sustainability & Benefits, Project Handoff, Statistical Process Control. Meaure: Summary Statistic, Critical To Quality Tree. Define: Project Charter, Voice Of The Customer, voice Of The Business, Process Map.
Slide 54: This is Our Vision slide. State it here.
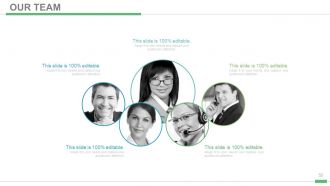
Slide 55: This is Our team slide with name, designation and text boxes to state information.
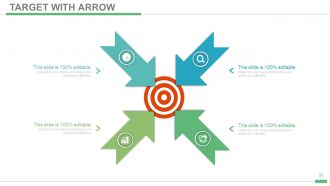
Slide 56: This is a Target with Arrow slide. State your targets here.
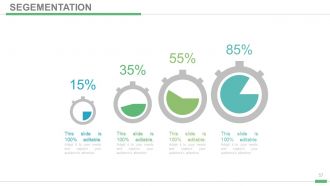
Slide 57: This slide is titled Segmentation to showcase market segments, product segments etc.
Slide 58: This is New Market Location slide of world map image. Mark specific locations for company growth, market etc. here.
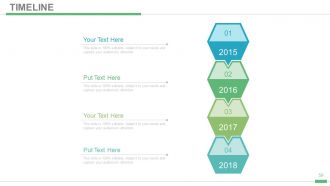
Slide 59: This is a Timeline slide to present important dates, evolution, milestones etc.
Slide 60: This is a Thank You slide for acknowledgement with address, contact numbers, and email.
Six sigma process improvement powerpoint presentation with slides with all 60 slides:
Increase hope with our Six Sigma Process Improvement Complete Powerpoint Deck With Slides. Boost the chances of a comfortable future.



FAQs for Six sigma process improvement powerpoint
So Six Sigma basically has five key things. Focus on what customers actually care about first. Then map out your processes to spot where stuff goes wrong. The third part is reducing variation and defects - honestly, the stats can be pretty overwhelming at first, but you get used to it. Getting your whole team involved is huge too, since they know the day-to-day issues better than anyone. Data-driven decisions instead of just winging it rounds it out. I'd say pick something small in your department and just start tracking where things consistently mess up. That's usually the easiest way to dive in.
Okay so defects are the actual bad stuff - things that don't meet what your customer wants. Variation is just normal fluctuation that happens in any process. Like if you're making 10cm widgets, getting one that's 12cm? That's a defect. But some coming out 9.9cm and others 10.1cm is just regular variation, which honestly happens everywhere. The trick is cutting down variation so you get fewer defects. First figure out what "good" looks like, then measure how much your results bounce around that target. Less bouncing = fewer screw-ups.
So DMAIC is your five-step game plan for Six Sigma projects. Define the problem first, then measure what's actually happening (baselines and all that). Next comes analyze - figuring out root causes. Most people want to skip straight to solutions here but trust me, don't. After that you implement improvements and set up controls so things don't backslide. Way better than the usual "let's try this and see what happens" approach. My old manager swore by it. Walking through these phases keeps everything data-driven instead of just winging it when you hit process problems.
Honestly, Six Sigma is basically like being a cost-cutting detective. You use this DMAIC thing (Define, Measure, Analyze, Improve, Control) to hunt down all the expensive stuff that shouldn't be happening - rework, delays, quality screwups, overproduction. The cool part? You're not just guessing where money's bleeding out. You've got actual data backing you up. Most companies I've heard about see 10-30% cost cuts in whatever processes they target. My advice - don't try to boil the ocean. Pick your biggest money pit first and go after that.
Honestly, data analysis is everything in Six Sigma - without it you're just guessing. Throughout DMAIC you'll be collecting metrics, running stats, creating control charts to track stuff over time. It helps you spot problems, dig into root causes, then actually prove if your fixes worked. The tricky part is figuring out what to measure upfront. Like, define what "success" looks like for your specific project before you start drowning in numbers. I learned this the hard way on my first project lol. When everything finally clicks though? Super satisfying seeing those performance improvements in black and white.
Yeah totally! Those two actually work really well together. Try using DMAIC during your retrospectives - it's way better than just randomly guessing what's broken. The data side helps you figure out if your changes actually did anything or if you're just fooling yourself. Teams get weird about velocity though and miss quality stuff completely. Pick your Definition of Done and throw some statistical tracking at defect rates. Honestly, start super small - grab one annoying thing this sprint and DMAIC the hell out of it. You'll be surprised how much cleaner your process gets.
So you'll want to start with control charts - they track how your process changes over time and honestly, once you figure them out they're incredibly useful. Process capability studies (Cp/Cpk) show if you're actually meeting your specs. Measurement system analysis is crucial too since bad data just leads to bad decisions. Pareto charts are great for figuring out which problems to fix first - why waste time on small stuff? Statistical process control charts become second nature after a while. Oh, and don't overlook basic stats like mean, standard deviation, process sigma levels. I'd jump into control charts and capability studies first though.
So Six Sigma is basically a step-by-step way to fix stuff that's broken in your company. There's this DMAIC thing - Define, Measure, Analyze, Improve, Control. Sounds fancy but it's just: figure out what sucks, gather real data about why it sucks, fix it, then make sure it stays fixed. Honestly, the best part is how it gets everyone thinking like problem-solvers instead of just accepting that things are messy. My advice? Pick one annoying process your team deals with and just try those five steps. You'll be surprised how much clearer everything becomes when you actually measure what's going wrong.
So you're gonna focus on defect rates (DPMO), process capability ratios like Cp/Cpk, cycle time, and cost savings mainly. Customer satisfaction scores matter too. DPMO gets super statistical - honestly kind of a pain but it's the gold standard for tracking quality improvements. Your process sigma level shows how many standard deviations sit between your process mean and spec limits. First-pass yield is another big one I forgot to mention. Just grab baseline measurements for whatever metrics actually matter to your project first, then track how they improve through each DMAIC phase. Pretty straightforward once you get rolling.
Yeah, totally! Six Sigma isn't just for factories - we've used it for healthcare stuff, banks, retail, you name it. The whole DMAIC thing works for any process that's driving you crazy. So instead of fixing broken widgets, you're tackling patient wait times or how long it takes to approve loans. Service processes can be even more chaotic than manufacturing honestly, which is why that structured approach helps so much. I'd start with whatever's causing the biggest headaches right now. Map out how things currently work vs how they should work. Those problem areas? Perfect Six Sigma territory.
So Green Belts are like part-time problem solvers - they keep their regular job but spend maybe 25% of their time on Six Sigma stuff, usually working on smaller projects in their own department. Black Belts are the full-time pros who live and breathe this stuff. They're tackling the big, messy cross-functional projects and mentoring the Green Belts too. Honestly, if you're thinking about getting certified, I'd probably start with Green Belt first. You can see if you actually like it before diving into the Black Belt commitment - that's a whole different level of intensity.
Honestly, the toughest part is just getting people to care. Everyone's already swamped with their regular work, so adding Six Sigma training feels impossible. Plus your team will probably roll their eyes - they've seen management initiatives come and go. Leadership needs to actually show up and support it, not just send an email about it. Oh, and your data better be solid from the start, otherwise you're building on quicksand. Start with something small that'll give you a quick win though. That momentum really helps sell people on the whole thing later.
Honestly, Six Sigma works because it actually gives people tools to fix the stuff that drives them crazy at work. You know those "why do we always do it this way?" moments? This helps eliminate that nonsense. People feel way more engaged when they can spot waste, improve processes, and see real results from their effort. The belt system (Yellow, Green, whatever) gives clear paths for moving up too. My advice? Start with the process nerds on your team - they'll get hooked and sell everyone else on it. Nothing beats having internal champions who've seen it work firsthand.
Manufacturing and healthcare are where Six Sigma really shines. GE saved billions with it in their plants, and hospitals use it all the time to cut down on medical errors. Banks have had decent luck too, mostly for operations stuff and reducing screw-ups in processing. It's kinda obvious when you think about it - works best when you've got repetitive processes you can actually measure. Oh, and financial services does alright with it. If you're gonna try it, start with your highest-volume processes where you have tons of data. That's where you'll see results fast and can convince people it's worth doing.
For Six Sigma ROI, you basically compare what you save versus what you spend. The big wins are usually the obvious stuff - fewer defects, less waste, faster processes. Customer satisfaction improvements count too, even though they're annoying to put numbers on. The math isn't rocket science once you figure out your starting point. My advice? Set up tracking from day one so you're not panicking later when your boss wants proof it worked. I've seen people scramble to find data after the fact and it's not pretty. Document everything as you go - trust me on this one.
-
Excellent template with unique design.
-
Out of the box and creative design.