


0514 lean six sigma tools powerpoint presentation




Try Before you Buy Download Free Sample Product
 Impress Your
 Audience
 100%
100% Editable
 Save Hours
 of Time


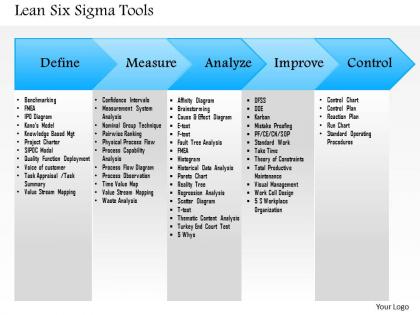
It is extremely important to decipher ways which can help in increasing revenue whilst reducing costs and by using the 0514 lean six sigma tools PowerPoint presentation, this is very much achievable. With lean six sigma tools PPT template, it becomes really easy to communicate with your team mates and instruct your subordinates as to how to encourage revenue figures and ensure that the costs remain constant. This is usually a tough thing to explain but with the six sigma tools Presentation design, it is very easy because the PPT layout contains a lot of details mentioned in as symmetrical fashion which makes it easier for the viewers to understand. This simplifies the job of the facilitator and helps other employees to pay requisite amount of attention towards the six sigma PPT design. Download the lean sigma tools Presentation template and help boost the revenue of the company by explaining essential parameters to your subordinates. Jack it up with our 0514 Lean Six Sigma Tools Powerpoint Presentation. Raise the level of your presentation.
People who downloaded this PowerPoint presentation also viewed the following :
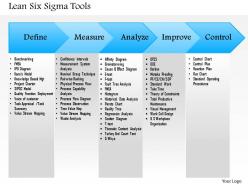
0514 lean six sigma tools powerpoint presentation with all 5 slides:
Did you know that the way you present and idea can either make it or kill it? When you want to impress the audience, your presentation should tell the story in a convincing way. 0514 Lean Six Sigma Tools Powerpoint Presentation that have been pre-prepared are what you need.
FAQs for 0514 lean six sigma
So Lean Six Sigma is pretty straightforward once you get it. You're trying to cut waste AND reduce inconsistencies at the same time. Think of it like cleaning out your process - toss anything that doesn't help customers (waiting around, making too much stuff, pointless steps). Six Sigma brings in the data side to catch defects early. DMAIC is your framework - Define, Measure, Analyze, Improve, Control. Honestly, just start by mapping what you're doing now and look for time drains. I bet you'll spot issues you didn't even realize were there. Way simpler than people make it sound!
So basically, Lean is all about speed - cutting out waste and bottlenecks. Six Sigma? That's your quality guy, focused on reducing defects and fixing inconsistent outputs. Got a slow process driving you crazy? Use Lean tools like value stream mapping. Customers complaining about quality issues? Time for Six Sigma's DMAIC approach with all that statistical analysis (honestly can be a bit much sometimes). Most companies I've seen just mix both approaches anyway. Makes sense - you want things fast AND good, right? Really depends on what's broken in your specific situation.
Oh DMAIC? Yeah it's just the five steps for Six Sigma projects - Define, Measure, Analyze, Improve, Control. So you start by nailing down what problem you're actually solving (harder than it sounds), then measure where you're at now. The analyze part is where you dig into why things are broken - honestly my favorite phase. After that you implement fixes and set up controls so everything doesn't fall apart later. Don't skip around though, each step builds on the last one. I learned that the hard way on my first project.
Think of Value Stream Mapping like having x-ray vision for your processes. Map out literally every step from beginning to end - all the handoffs, delays, weird bottlenecks nobody talks about. When you actually put it all on paper, you'll be genuinely shocked at what surfaces. The cool part is comparing your current mess to what an ideal version could look like. Suddenly you're staring at all this wasted time and motion you've been ignoring forever. Pick your most annoying process first (trust me on this one). You won't believe how much inefficiency you've just been accepting as normal.
Start with Value Stream Mapping - it'll show you exactly where time gets wasted. Kaizen events work great for quick wins since you can hit bottlenecks fast. I've honestly seen teams get way too obsessed with fancy statistical stuff when basic tools work better. 5S eliminates all that searching and waiting around (which adds up more than you'd think). Takt Time analysis helps pace work with what customers actually need. SMED's amazing if changeovers are killing your time. But seriously, map your current state first, spot the biggest time wasters, then pick whatever tool makes sense for each problem.
So the Fishbone Diagram is actually pretty genius for troubleshooting. You break everything down into categories - People, Process, Materials, Environment - that way you're not just wildly guessing what went wrong. Work through each "bone" systematically with your team. The visual layout makes it way easier to spot connections you'd normally miss. Honestly beats random brainstorming sessions that go nowhere. Start by getting crystal clear on the actual problem, then dive into each category. I've seen teams catch root causes they would've totally overlooked otherwise. It's like having a roadmap instead of wandering around blind.
So basically you plot your data over time and watch for stuff that goes outside the normal range - that's your cue to dig deeper. Control charts are honestly pretty sweet for catching problems early instead of waiting for angry customers to call. They show you the difference between regular ups and downs (totally normal) versus actual issues that need fixing. I'd set them up for whatever metrics matter most to your process. Check them regularly though - like, don't just create them and forget about them. Way better than playing defense all the time.
So Pareto Analysis is basically the 80/20 rule for quality stuff. You know how a few problems always cause most of your headaches? That's exactly what this helps you find. Rank your issues by how often they happen or what they cost you. Usually just 2-3 things are behind like 80% of your troubles - it's wild how consistent this pattern is. Way better than trying to fix everything at once, which honestly just burns everyone out. Plus when you need budget or resources, you've got real data showing management which fires need putting out first. Super helpful when you're drowning in defects or complaints.
So here's what worked for us - pick your most enthusiastic team first as a pilot. Train them on the 5S basics: Sort out unnecessary stuff, Set everything in Order, Shine (aka clean), Standardize the process, then Sustain it. The sustaining part is brutal honestly. People get lazy after a few weeks. Visual stuff helps tons - labels everywhere, checklists posted up. Leadership has to actually show up and make a big deal about early wins or it'll die fast. Oh and don't try rolling it out everywhere at once. That's a recipe for disaster.
FMEA flips the script on risk management - you're hunting down problems before they bite you instead of scrambling after disasters hit. Map out your critical processes first, then dig into what could go wrong. Your team brainstorms failure scenarios and ranks them with Risk Priority Numbers to figure out what needs fixing ASAP. Honestly, the sessions can get pretty intense when people realize how many landmines they've been walking past daily. But that's the point - you'll spot risks that were totally invisible before and actually have plans ready when stuff inevitably breaks.
VoC data makes sure you're actually fixing what customers care about - not just what you think needs fixing. Honestly, I've watched so many projects tank because teams built solutions for problems that didn't really exist. You capture their real pain points and what they value, then use that to prioritize improvements that'll boost satisfaction. It's pretty straightforward but makes a huge difference in success rates. Use VoC to define your CTQs and validate you're solving actual customer needs instead of internal assumptions. Oh, and collect it early in Define phase - don't wait until you're halfway through the project.
Honestly, the biggest pain points are always the same - people hate change, nobody gets proper training, and teams try to do everything at once. Classic mistake. Your employees will probably roll their eyes at "another new system from management." Start with just one or two tools that'll actually make a difference. Train your best people first so they can help others later. Leadership needs to show they're serious about this, not just following some trend. Get some quick wins early - people need to see it's worth their time. And here's the thing: connect everything to problems they're already frustrated about solving.
Set clear boundaries first - teams love going down rabbit holes otherwise. Get the actual workers in there, not just managers who think they know the process. Executive buy-in is huge too, or your changes just die on the vine (learned that one the hard way). Three to five days tops - any longer and people check out mentally. Document as you go instead of scrambling at the end. Action items need real owners and deadlines. Oh, and book your follow-up meetings before everyone leaves the room. That 30-60-90 day check-in won't happen if you wait.
So SPC is basically like having an early warning system for when your process starts acting weird. Control charts show you trends and shifts way before things go completely sideways. I've seen too many people just wait for customer complaints instead of watching the data - big mistake. You can actually catch root causes while they're still small issues. Set up charts for your most critical parameters first, don't try to track everything at once. The patterns that show up are honestly pretty fascinating once you get into it. Short version: monitor continuously, investigate early, fix fast.
Track the money stuff first - cost savings, ROI, revenue boosts from your projects. But honestly, the operational metrics matter just as much. Defect rates, how fast processes run, customer happiness scores. I've watched teams obsess over dollars and completely miss whether they're actually improving anything. Employee engagement is huge too - if people aren't bought in, your whole initiative tanks. Oh, and track how many folks you're training. Start with maybe 3-4 metrics that actually match what your company cares about, then build from there once you've got momentum.
-
Perfect template with attractive color combination.
-
Easily Understandable slides.