


Six sigma process powerpoint presentation with slides





Try Before you Buy Download Free Sample Product
 Impress Your
 Audience
 100%
100% Editable
 Save Hours
 of Time


Struggling to bring perfection in your business operations? Just download our six sigma process PPT model and deliver jaw dropping PowerPoint presentation thereby inspiring your employees to eliminate defects in business processes. Not only eliminating defects, but this PPT sample also fits well to motivate employees for time management as well as for supply chain management in order to enhance customer loyalty. Bearing this in mind, to aptly address the topic we have conceptualized exclusive PowerPoint templates like of Six sigma road map, Why six sigma, Six sigma methodologies, The DMAIC process and many more. All in all, this PowerPoint show proves handy for companies looking to implement six sigma techniques in their operations. What are you thinking now? Just download this readymade PPT sample file depicting lean process and push your productivity and profitability to hit the highest point.
People who downloaded this PowerPoint presentation also viewed the following :
Content of this Powerpoint Presentation
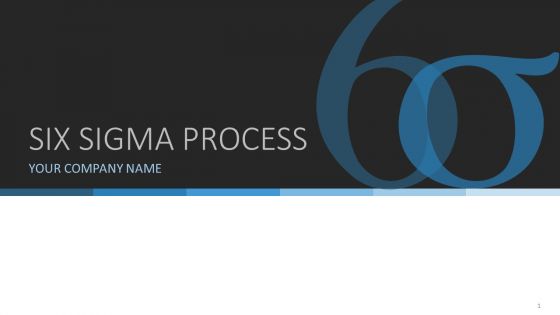
Slide 1: This slide introduces Six Sigma Process. State Your Company Name and get started.
Slide 2: This is an Agenda slide. State your agendas here.
Slide 3: This is Our Mission slide with imagery. State your mission aspects here.
Slide 4: This slide presents Our team with name, designation and image boxes.
Slide 5: This is an About Us slide. State team/company specifications here.
Slide 6: This is a Target With Arrow image slide to state targets, etc.
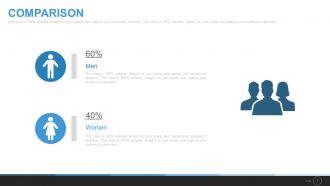
Slide 7: This is a Comparison slide to compare product/enitities etc.
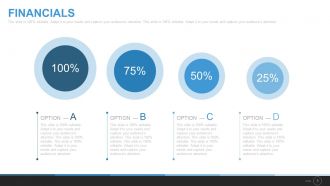
Slide 8: This is a Financial Scores slide. State financial aspects, etc. here.
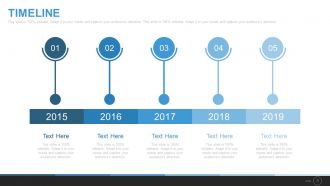
Slide 9: This is a Timeline image slide to present growth factors, highlights, evolution, milestones etc.
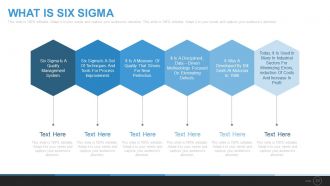
Slide 10: This slide showcases What Is Six Sigma in the following points- Six Sigma Is A Quality Management System, Six Sigma Is A Set Of Techniques And Tools For Process Improvement, It Is A Measure Of Quality That Strives For Near Perfection, It Is A Disciplined , Data – Driven Methodology Focused On Eliminating Defects, It Was A Developed By Bill Smith At Motorola In 1986. Today, it is Used in many in industrial sectors for minimizing errors,reduction of costs and increase in profit
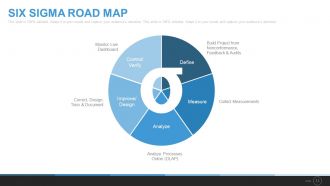
Slide 11: This slide presents a Six Sigma Roadmap with- Control/Verify Define Improve/Design Measure Analyze Build Project from Nonconformance, Feedback & Audits Monitor Live Dashboard Collect Measurements Correct, Design, Train & Document Analyze Processes Online (OLAP)
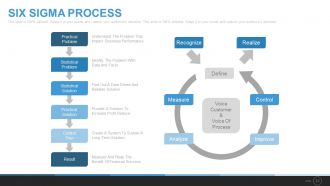
Slide 12: This slide presents Six Sigma Process with the following points- Practical Problem, Statistical Problem, Statistical Solution, Practical Solution, Control, Plan, Result, Recognize, Realize, Define, Measure, Analyze, Control, Improve, Voice customer, & Voice of process.
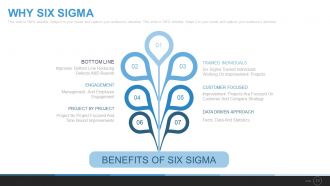
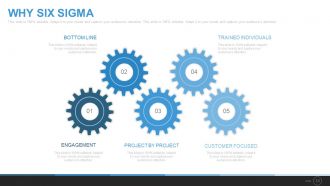
Slide 13: This slide showcases Why Six Sigma with Benefits of Six Sigma listed as- TRAINED INDIVIDUALS: Six Sigma Trained Individuals, Working On Improvement Projects. CUSTOMER FOCUSED: Improvement Projects Are Focused On, Customer And Company Strategy, DATA DRIVEN APPROACH, Facts, Data And Statistics. BOTTOM LINE: Improves Bottom Line Reducing, Defects AND Rework. ENGAGEMENT: Management And Employee, Engagement. PROJECT BY PROJECT Project By Project Focused And, Time Bound Improvements:
Slide 14: This slide presents Why Six Sigma with- Bottom Line, Trained Individuals, Engagement, Project By Project, Customer Focused.
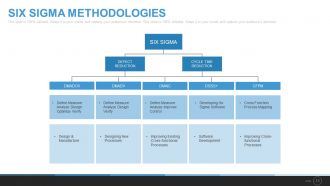
Slide 15: This slide presents Six Sigma Methodologies with Defect Redcution and Cycle Time Reduction making the top segregations dividing into- Define Measure Analyse Design Optimize verify, Define Measure Analyse Design verify, Define Measure Analyze Improve Control, Developing Six Sigma Software, Cross Function Process Mapping, Design & Manufacture, Designing New Processes, Improving Existing Cross-functional Processes, Software Development, Improving Cross-functional Processes.
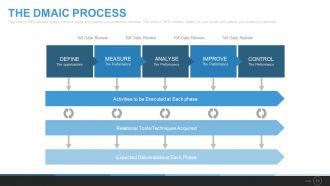
Slide 16: This slide presents The DMAIC Process as- DEFINE The opportunities MEASURE The Performance ANALYSE The Performance IMPROVE The Performance CONTROL The Performance. Activities to be Executed at Each phase with Relational Tools/Techniques Acquired and Expected Deliverables at Each Phase with Toll Gate Review.
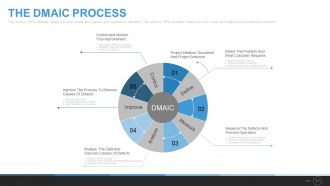
Slide 17: This slide showcases The DMAIC Process with the following points- Define the problem and what customer requires 1. Select Project –CTO’S, 2. Create Project Charter, 3. Develop High-Level Process Map. Measure the defects and Process operation 1. Identify Project Output Metric, 2. Develop Data Collection Plan, 3. Establish Process Baseline. Analyze the data and discover causes of defects 1. Identify Root Causes, 2. Validate Root Causes And Determine..Vitalfew’’, 3. Quantify The Opportunity. Improve the process to remove causes of defects- 1. Identify Solution, 2. Refine And Test Solution, 3. Cost Benefit Calculation. Control and monitor your improvement 1. Implement Process Control, 2. Prepare Roll-Out Solution, 3. Project Closure.
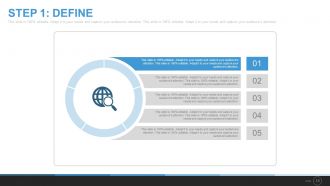
Slide 18: This slide showcases STEP 1: DEFINE of DMAIC process.
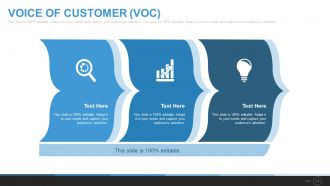
Slide 19: This slide showcases Voice Of Customer (VOC) of DMAIC process.
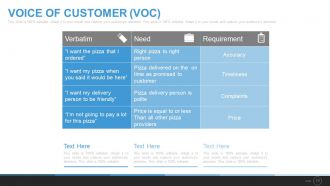
Slide 20: This slide showcases Voice Of Customer(VOC) of DMAIC process with Verbatim, Need and Requirement.
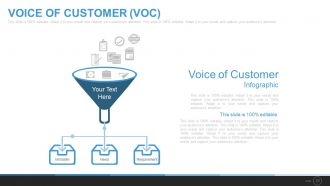
Slide 21: This slide showcases Voice Of Customer (VOC) of DMAIC process with icon imagery.
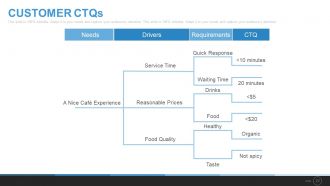
Slide 22: This slide showcases Customer CTQs with the following subheadings- Needs, Drivers, Requirements, CTQ.
Slide 23: This slide presents a Kano Analysis displaying- Customer Needs In The Kano Model, Exciter, Performance, Basic, Implementation Level.
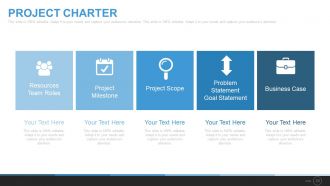
Slide 24: This slide presents a Project Charter with- Resources, Team Roles, Project, Milestone, Project Scope, Problem Statement, Goal Statement, Business Case.
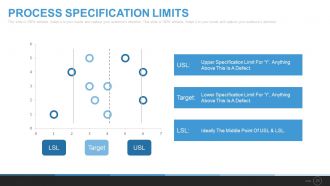
Slide 25: This slide displays Process Specification Limits USL: Upper Specification Limit for ‘Y’, anything above this is a defect. Ideally the middle point of USL & LSL. LSL: Lower Specification Limit for ‘Y’, anything above this is a defect. and Target.
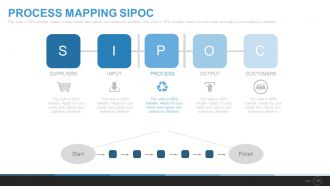
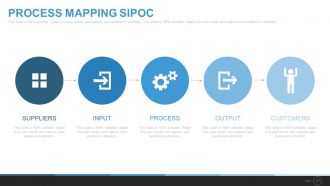
Slide 26: This slide displays Process Mapping SIPOC- Suppliers, Input, Process, Output, Customers.
Slide 27: This slide also displays Process Mapping SIPOC- Suppliers, Input, Process, Output, Customers.
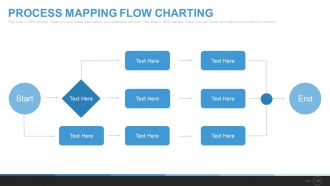
Slide 28: This slide shows Process Mapping Flow Charting. Present information, specifications etc. here.
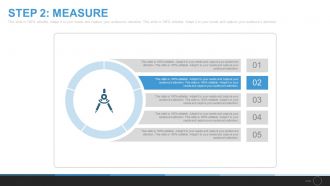
Slide 29: This slide displays STEP 2: MEASURE of DMAIC process.
Slide 30: This slide showcases Stakeholder Analysis with the following points- Level of commitment, Enthusiastic support, Help it work, Compliant, Hesitant, Indifferent, Uncooperative, Opposed, Hostile, People or groups.
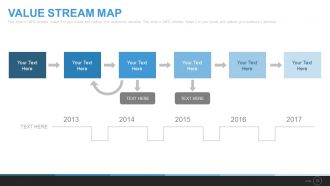
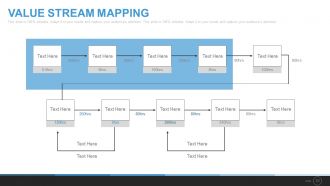
Slide 31: This slide shows a Value Stream Map. Present information, specifications etc. here.
Slide 32: This slide presents Value Stream Mapping. Present information, specifications etc. here.
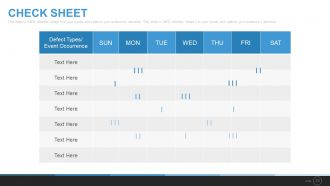
Slide 33: This is a Check Sheet slide. Present information, specifications etc. here.
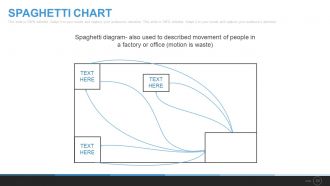
Slide 34: This is a Spaghetti slide to show information, specifications etc.
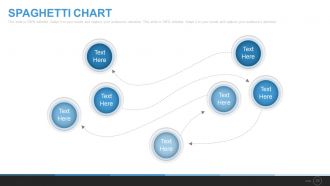
Slide 35: This is also a Spaghetti slide to show information, specifications etc.
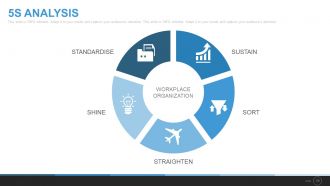
Slide 36: This slide presents 5s Analsyis listed as- Standardise, Sustain, Straighten, Shine, and Sort.
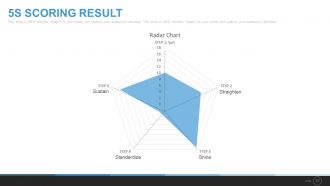
Slide 37: This slide presents 5s Scoring Result in Radar Chart form.
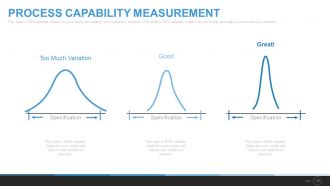
Slide 38: This slide showcases Process Capability Measurement in terms of Specification with Too Much Variation, Good, and Great! as parameters.
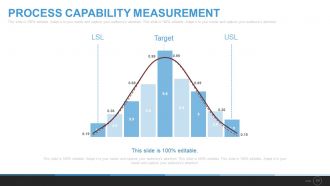
Slide 39: This slide showcases Process Capability Measurement in bar graph form.
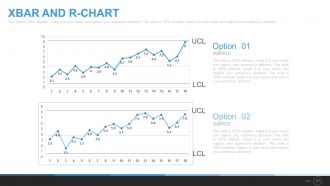
Slide 40: This slide presents a XBAR and R-CHART. Present information, specifications etc. here.
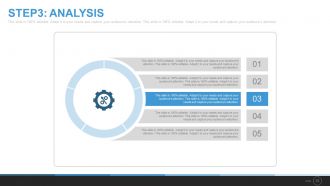
Slide 41: This slide presents STEP3: ANALYSIS of DMAIC process.
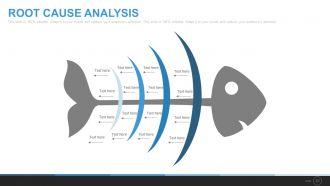
Slide 42: This slide presents a Root Cause Analysis in Fishbone diagram form.
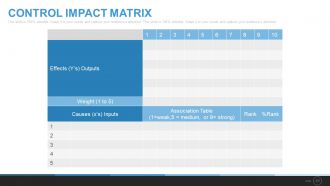
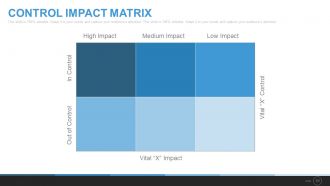
Slide 43: This slide presents a Control Impact Matrix.
Slide 44: This slide also presents a Control Impact Matrix with Impact and Control as parameters.
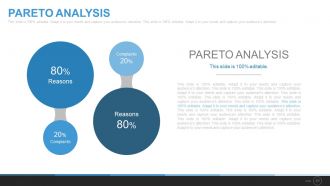
Slide 45: This slide showcases a Pareto Analysis.
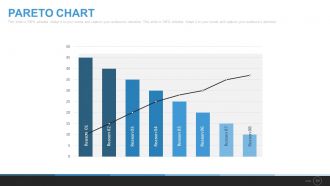
Slide 46: This slide showcases a Pareto Chart.
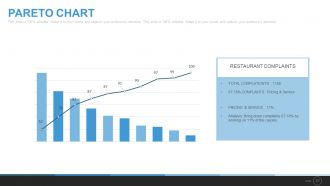
Slide 47: This slide showcases a Pareto Chart.
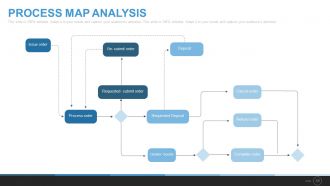
Slide 48: This slide presents Process Map Analysis with- Complete order, Issue order, Re- submit order, Deposit, Requested- submit order, Process order, Refund order, Cancel order, Requested Deposit, Deliver Goods.
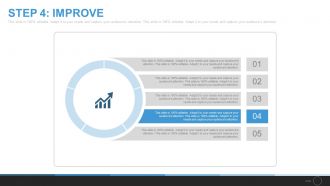
Slide 49: This slide presents STEP 4: Improve of DMAIC process.
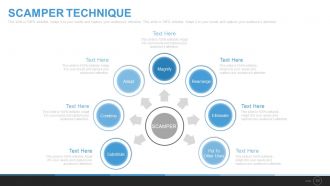
Slide 50: This slide showcases Scamper Technique displaying- Combine, Substitute, Adapt, Magnify, Rearrange, Eliminate, Put To Other Uses.
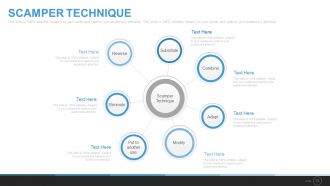
Slide 51: This slide presents Scamper Technique displaying- Reverse, Substitute, Combine, Adapt, Modify, Put to another use, Eliminate.
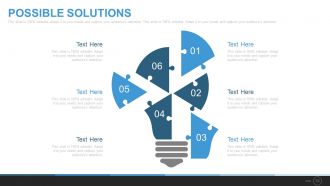
Slide 52: This slide showcases Possible Solutions with creative bulb imagery.
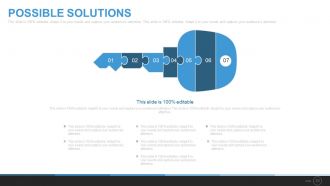
Slide 53: This slide showcases Possible Solutions with creative key imagery.
Slide 54: This slide shows Cost Benefit Analysis in balancing scale image.
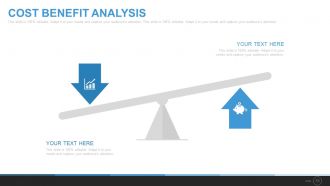
Slide 55: This slide shows Cost Benefit Analysis in see-saw image.
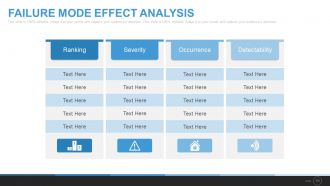
Slide 56: This slide shows Failure Mode Effect Analysis with- Ranking, Severity, Occurrence, Detectability.
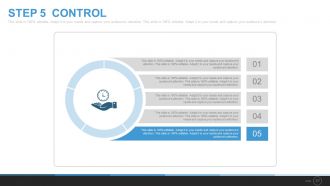
Slide 57: This slide showcases STEP 5 Control of DMAIC process.
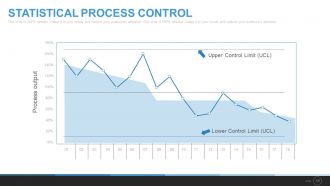
Slide 58: This slide presents Statistical Process Control with- Upper Control Limit (UCL), Lower Control Limit (UCL), Process output.
Slide 59: This slide presents The DMADV Method. Present information, specifications etc. here.
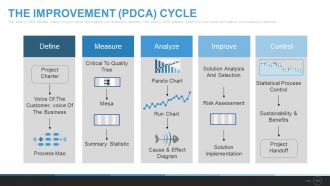
Slide 60: This slide showcases The Improvement (PDCA) Cycle displaying- Measure: MSA, Critical to Quality tree, Summary Statistic, Improve: Solution analysis and selection, Risk Assessment, Solution Implementation. Analyze: Cause & Effect Diagram, Pareto chart, Run chart. Define: Project charter, Process Mao, Voice of the customer,voice of the business. Control: Statistical process control, Sustainability & benefits, Project Handoff.
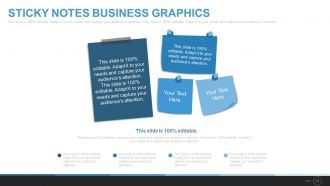
Slide 61: This slide displays Sticky Notes Business Graphics. State important events, information etc. here.
Slide 62: This slide showcases Newspaper Layouts image. State important events, information etc. here.
Slide 63: This slide presents AF Blue Target Dart With Red Arrow. State targets, goals etc. here.
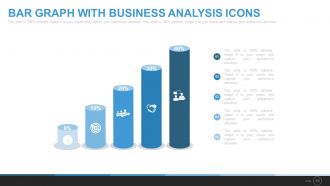
Slide 64: This is a Bar Graph With Business Analysis Icons slide to show product/entity comparison.
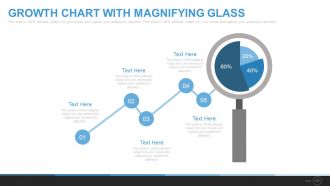
Slide 65: This slide showcases a Growth Chart With Magnifying Glass.
Slide 66: This is a Thank You slide with imagery for acknowledgement.
Six sigma process powerpoint presentation with slides with all 66 slides:
Your best will emerge with our Six Sigma Process Complete Powerpoint Deck With Slides. Your excellent attributes will come to the fore.







FAQs for Six sigma process powerpoint
Look, Six Sigma breaks down into five main things: obsess over what customers actually want, use real data instead of just guessing, fix processes methodically (not randomly), get everyone involved, and aim for almost perfect quality. The whole 3.4 defects per million thing sounds insane but honestly it works. DMAIC is your go-to framework - Define, Measure, Analyze, Improve, Control. Just pick something small that's driving your team nuts and work through those steps. Don't overthink it at first.
Yeah, Six Sigma totally works for service stuff! You're just measuring different things - like how long customers wait or whether calls get resolved properly instead of product defects. The whole DMAIC thing stays the same though, which is nice. Start by figuring out what "quality" means for your service (response time under 24 hours or whatever), then measure how you're actually doing. Look for where things get stuck or slow down. Honestly, just think about what pisses off your customers the most - that's usually where you'll find the best wins. Wait times are a big one.
So DMAIC fixes broken stuff - you're basically troubleshooting what's already there. Define the problem, measure how bad it is, analyze why it sucks, improve it, then control it so it doesn't break again. DMADV is different though - that's when you're building something completely new. You define what customers actually want, measure their needs, analyze design options, design the whole thing, then verify it works. Most people I know start with DMAIC because it's way easier to grasp. My old manager always said fix what's broken before you build new things.
So basically Six Sigma finds what's screwing up your process and fixes it using actual data instead of guesswork. The DMAIC thing gives you steps - Define, Measure, Analyze, Improve, Control. Pretty straightforward but kinda boring if I'm being honest. You measure everything, figure out what's causing the inconsistencies, then standardize stuff so you get the same results every time. Less defects, more predictable outcomes. I'd start by mapping out your current process first - see where things go sideways the most. Once you spot those problem areas, you can actually do something about them instead of just hoping for the best.
Dude, your leadership has to actually care - not just pretend to. They need to put real money behind it and celebrate when teams hit wins. Culture's probably even bigger though? Your whole organization needs to be cool with making decisions based on data instead of gut feelings. Some people freak out when you start questioning how things have "always been done" lol. Without both pieces, Six Sigma just turns into another corporate fad that disappears in six months. Oh, and train your executives first - they can't support something they don't understand.
Yeah, totally works! I've seen teams do this really well. Use Six Sigma's DMAIC stuff for the bigger, longer-term fixes while your sprints stay focused on shipping fast. Different timescales, but they play nice together. You'd basically analyze your Agile processes with Six Sigma tools - like why defect rates suck or how to make sprint planning less painful. Here's what I'd do: spot the recurring problems that keep screwing up your sprints, then run Six Sigma improvement projects alongside your normal dev work. It's honestly pretty cool when you get both working together. Start small though - maybe pick one annoying process issue first.
So you've got DMAIC as your main framework - that's Define, Measure, Analyze, Improve, Control. Pretty much the backbone of everything. Then there's control charts, process mapping, fishbone diagrams, Pareto analysis. The usual suspects. For the heavy statistical stuff, you're looking at hypothesis testing and regression analysis, but honestly the software handles most calculations now (thank god). Root cause analysis is huge. Value stream mapping too. Oh, and design of experiments if you really want to get fancy. My take? Master the basics and DMAIC first. Don't jump into complex stats right away - you'll just confuse yourself.
Track both the obvious stuff and the harder-to-measure wins. Calculate your actual savings - less defects, faster processes, lower costs. That's your hard ROI. But don't ignore things like happier customers and better employee morale, even though they're annoying to quantify. Most companies hit 3-5x ROI in year one if they're not screwing it up. Oh, and definitely baseline everything first - you can't prove improvement without knowing where you started. A monthly dashboard keeps everyone honest about the numbers.
Honestly, the biggest pain points are always people hating change and leadership not backing you up. Even when processes suck, teams get used to them - it's just how we work, you know? Bad training makes everything worse, plus they'll give you impossible deadlines. Data quality is a nightmare since Six Sigma needs solid numbers to actually work. Oh, and good luck getting resources when everyone's already swamped. Don't go after huge projects first though. Pick some easy wins to show it actually works, then tackle the big stuff once people are on board.
So data analytics basically takes your Six Sigma work to the next level. You'll catch process issues and root causes that old-school methods totally miss. Machine learning can find patterns in huge datasets - honestly saves you from going cross-eyed staring at spreadsheets for hours. Predictive stuff helps you spot defects before they actually happen, which is pretty cool. Real-time dashboards make tracking your DMAIC progress way less painful. The stats get much more solid when you're working with bigger, cleaner data. I'd start by figuring out where you can automate data collection in your current projects. That's usually what makes the biggest difference right off the bat.
Honestly, you really need people from different departments on your Six Sigma team. Operations, IT, customer service - whoever touches your process. Different perspectives help you spot problems you'd totally miss otherwise. Like, the IT person might catch a system glitch that operations doesn't even know exists. Plus when you build solutions, they'll actually work across the whole company instead of just one area. I learned this the hard way on my last project - we forgot to include finance early on and had to redesign everything later. Such a pain. Get all your stakeholders involved from day one.
Dude, Six Sigma training is all over the place depending on your company. Some places go crazy with the whole Belt system - Yellow, Green, Black, Master Black certifications and everything. Others just throw you into a basic workshop or make you watch online videos. Your company might team up with big names like ASQ or Motorola University, or they'll create their own thing that fits what you guys actually do. The requirements and tools they focus on can be totally different from place to place. Honestly? Before you dive in, I'd double-check what certs your industry actually cares about and if your company's program will mean anything if you switch jobs later.
GE saved billions with Six Sigma - they're like the poster child for it. Motorola actually created the whole thing and used it to fix their electronics defect rates. Amazon's doing it too for their warehouses and shipping (honestly makes sense why packages show up so damn fast). Cleveland Clinic and other hospitals jumped on board to cut down medical errors and wait times. The real trick isn't just using it once though. These companies baked it into their culture and got everyone trained on it, not just management.
Yeah, totally doable on a budget! Start by getting one or two people trained through online courses or community college - honestly way cheaper than I expected when I looked into it. Pick one problem that's actually bleeding money or annoying customers. Excel handles most of the data stuff just fine, no need for expensive software. Process mapping and root cause analysis are your best friends here. Once you nail that first project and show it's worth it, then you can slowly grow from there. The trick is proving it works before going bigger.
Don't mess with your data to make results look prettier than they actually are - I've watched teams do this and it always bites them later. Talk to employees before changing their processes, especially if it might affect their jobs. Customer privacy matters too when you're digging through all that data. Honestly, Six Sigma people get so obsessed with hitting their numbers that they forget real humans are involved. Keep everyone in the loop about what you're tracking and why. Also think about whether your "improvements" might screw things up for other departments down the line.
-
Great quality slides in rapid time.
-
Great product with highly impressive and engaging designs.