


Spider chart template





Try Before you Buy Download Free Sample Product
 Impress Your
Audience
 100%
Editable
 Save Hours
of Time


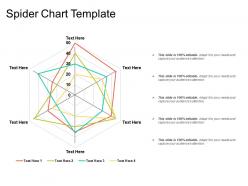
Plot one or more series of values over multiple quantitative variables with the help of this attention-grabbing Spider Chart Template. Visualize multivariate data by employing our easy-to-use spider chart PPT slide. This radar chart PPT template can be used to display the applications which include displaying performance metrics of any ongoing program. It is easy to display multivariate data in the form of a two-dimensional chart of three or more quantitative variables by using this two-dimensional chart PowerPoint visual. Showcase the method to make the spider chart by using this web chart PPT template. Outline the major steps to create spider charts for competitive analysis by taking the assistance of this ready-to-use PPT theme. Take the advantage of star chart PPT layout for competitive analysis. You can present the methods to create a radar chart by employing this visually appealing PowerPoint theme. Make your presentation attention-grabbing by mentioning the examples of the spider chart. Thus, create a meaningful presentation by downloading the aesthetically appealing polar chart PPT slideshow.
People who downloaded this PowerPoint presentation also viewed the following :
Spider chart template with all 5 slides:
Our Spider Chart Template truly pack a punch. They will get you ahead on crucial points.


FAQs for
Honestly, spider charts are perfect when you need to compare a bunch of variables at once. Like if you're looking at different products and want to see how they stack up on price, quality, features - all that stuff in one view. Makes it super easy to spot where things are strong or weak. I'd say stick to around 3-8 variables though, otherwise it gets messy. The template thing is clutch too because building those axes manually is such a pain. They're solid for presentations when you've got stakeholders who want the big picture fast. Just don't go overboard with too many data points.
Spider charts are perfect for this kind of stuff - you can see multiple metrics at once instead of getting lost in endless spreadsheet rows. They show patterns super clearly when you're comparing vendors or whatever. Like, you'll instantly spot if one option crushes it on price but sucks at support quality. Honestly, I use them all the time now because stakeholders actually pay attention to visuals. Way better than rattling off numbers. Plus they look kind of cool? Definitely try one next time you're doing vendor comparisons - it cuts through so much BS discussion.
So spider charts are perfect for comparing stuff across multiple categories - like when you're looking at performance metrics or survey data with different dimensions. They're amazing for spotting patterns in related data points quickly. Way more visual than staring at spreadsheets all day! Keep it to 3-8 variables though, otherwise it gets cluttered and nobody can read the damn thing. Perfect for things like team skill comparisons or tracking multiple KPIs over time. Honestly, they make weaknesses super obvious at a glance.
Oh totally! Spider charts are perfect for that. Each variable gets its own line shooting out from the center, so you can see everything at once. The cool thing is how each dataset creates this unique "shape" - makes it super obvious where things are strong or weak. I'd stick to maybe 3-5 different data series though, otherwise it turns into a hot mess real quick. Different colors help a lot, and honestly? A little transparency can save your life when lines overlap. They're clutch for comparing performance profiles or seeing how stuff changes over time. The visual just clicks, you know?
Oh tons of teams use these! Marketing loves comparing brand stuff - awareness, engagement, all that. Finance tracks ROI and cash flow metrics (honestly makes those boring reports way easier to digest). HR uses them for employee reviews - skills, performance, development areas. Operations teams plot quality and safety across different locations. You can really customize the axes for whatever your department cares about most. Just pick like 3-8 key things and start plotting. I've seen some teams go overboard with too many metrics though - gets messy fast.
Okay so for spider charts, you'll want clear labels around the outside describing what you're measuring. Keep it to like 5-8 categories max or it gets messy real quick. Use a circular grid with consistent scales - 3 to 5 levels usually works fine. Center should be zero, then values go up as you move out. If you're comparing multiple things, definitely add a legend. And please don't use neon colors that burn people's retinas lol. I learned that one the hard way. Test it with actual data first before calling it done - trust me on this.
Honestly, customizing spider charts is worth the extra few minutes. Generic templates just make people's eyes glaze over – I swear it's like visual white noise. But when you match colors to your brand and use labels that actually make sense to your audience, suddenly everyone's paying attention. Focus on your most important metrics first, then build around those. The visual hierarchy thing really works too – highlight what matters most and people will lean in instead of checking their phones. I've watched boring data turn into actual conversations just because someone bothered to make it look intentional.
Just use Excel honestly - their radar chart thing works fine and you probably already have it. PowerPoint's got templates too. Google Sheets is solid if you're working with other people. Tableau and Power BI look way better but they're expensive and kinda overkill unless you're doing this professionally. Oh, Canva actually has some that don't look terrible if you want something prettier without learning new software. I'd go Excel first though - it's not gonna win any design awards but it'll get your chart done fast.
So spider charts are perfect when you're comparing tons of variables at once - like if you want to see how different products stack up across multiple features. Bar charts? Way better for simple stuff honestly. Line charts show trends over time, but spider charts give you this cool "shape" of your data that's pretty unique. I'd probably use them for performance snapshots or survey results where you need to see everything at a glance. Just don't use them with executives - they'll get confused and you'll spend forever explaining it. Stick to bar charts for those meetings, trust me.
Oh for sure, there's some stuff that'll trip you up. First off - don't throw like 10 variables on there, it just looks like a hot mess. Your scales need to match up too, otherwise you're basically manipulating the data (learned that one the hard way lol). Try to pick things that actually relate to each other... comparing sales numbers to employee happiness scores is kinda pointless. The thing that gets most people though? Mixing units without fixing them first - like dollars vs percentages. Stick to maybe 5 variables tops. And seriously, label everything clearly so people don't have to guess what they're staring at.
Yeah, totally doable! Most platforms like Tableau, Power BI, and Google Data Studio work fine with spider charts. Just get your data formatted right first - metrics in columns, categories as rows. Excel can be a bit finicky honestly, but you can usually export/import templates or just rebuild using whatever native chart tools your platform has. I'd stick with whatever your team's already using for other stuff though - way easier than having dashboards scattered everywhere. Oh, and some tools definitely play nicer together than others, so don't stress if the first method doesn't work perfectly.
Oh man, color schemes can totally make or break spider charts. You definitely want distinct colors for each data series - otherwise people can't follow the lines around the web. High contrast is key, especially if you're printing or presenting to a room full of people. I'd stick with maybe 3-5 colors max so it doesn't get overwhelming. One trick I like is using colors that actually mean something - like red for problem areas and green for the good stuff. Test it out first though, because what looks great on your screen might be terrible projected on a wall.
Yeah, cultural stuff totally affects how people read spider charts. Western folks usually scan clockwise and expect performance metrics at the top. But other cultures might start elsewhere or care more about group data than individual stats. Color choices can bite you too - red screams "bad" to some people but means good luck to others. Some audiences need you to walk them through it, others get it instantly. Honestly? Run it by someone from that culture first if you can. Or just throw in a quick legend so nobody gets confused. Way easier than explaining afterwards.
So with spider charts, I always look at the overall shape first - that's where you'll get the main story. Points far from center? Those are your strong areas. Stuff hugging the middle means you've got room to grow there. Honestly, they're pretty great for spotting patterns across different metrics without getting lost in the details. Don't stress about tiny differences between neighboring points though. Focus on the big spikes and valleys instead. The real magic happens when you layer multiple datasets on top of each other - makes comparing things super easy and you can see imbalances right away.
Honestly, spider charts are a game-changer for team stuff. Everyone fills out the same template, so you're comparing apples to apples. Like, marketing might rate brand strength as an 8 while sales says it's a 6 - boom, right there you can see the disconnect without anyone getting defensive about it. You can even stack multiple people's charts on top of each other to spot weird patterns. I always make my team do these before big meetings now (saves like 30 minutes of back-and-forth). Just send the template around beforehand and compare results when you meet.
-
Topic best represented with attractive design.
-
Easily Editable.