

Multiple charts sample presentation ppt





Try Before you Buy Download Free Sample Product
 Impress Your
Audience
 100%
Editable
 Save Hours
of Time


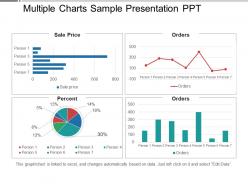
Get an effective hold on cost controls with our multiple charts sample presentation PPT. This process helps in cost-cutting and bringing down inflation. This template will help in reducing real business expenses and identifying the ways of boosting profits. The deck mainly consists of a four-stage process that has multiple charts, graphs, tables, and grids. We have shown engaging color patterns and icons here to make this PPT design more interactive. These stages help in identifying sale prices for different clients and the percentage each person is contributing to the overall sale, You can also view the number of orders by different clients in both graph and table formats. This PPT can be edited as per the requirements. Include your key points and get your ideas across through the help of a PowerPoint template. Download our multiple charts sample presentation PPT and engage with your audience. Deliberate on cost controls with our Multiple Charts Sample Presentation Ppt. It will help bring down inflation.
People who downloaded this PowerPoint presentation also viewed the following :
Multiple charts sample presentation ppt with all 5 slides:
Drive the debate with our Multiple Charts Sample Presentation Ppt. Fix the attention of your audience on the issue.

FAQs for Multiple charts
Honestly, it all comes down to three things: clarity, accuracy, and smart design choices. Pick the right chart for what you're trying to show - bar charts for comparisons, line graphs for trends, that kind of thing. Keep it clean though. Cluttered dashboards are the worst and nobody has time for that mess. Use colors that actually mean something instead of just picking whatever looks pretty. Label everything clearly so people aren't guessing what they're looking at. Oh, and here's the key part - figure out what decision your audience needs to make first, then work backwards from there. Makes the whole process way easier.
Dude, color choice literally makes or breaks data visualization. Red and green together? Colorblind people won't see the difference at all. For showing progression, stick with sequential colors like light to dark blue. Diverging palettes work when there's a meaningful center point. People automatically think red = bad, green = good in Western culture, so that matters too. Honestly, I always run my charts by a couple coworkers first - saves me from looking stupid later. Oh, and ColorBrewer is clutch for finding accessible color schemes. Don't forget a clear legend either.
Ugh, where do I even start? Don't use those awful 3D pie charts - they're literally unreadable. Misleading scales are huge too, like when people mess with the y-axis to make tiny changes look massive. Wrong chart types drive me crazy - bar charts aren't always the answer! Oh, and "chart junk" is real - too much decoration just confuses people. Colors should actually serve a purpose, not just look Instagram-ready. Also make sure colorblind folks can read your stuff. If explaining your chart takes forever, you've overcomplicated it. Keep things simple and your audience will thank you.
Bar charts are my default for comparing stuff or rankings - they just work. For trends over time, go with line charts. Pie charts can show parts of a whole but honestly, more than 5 slices and it looks like a mess. Scatter plots are great for seeing if two things relate to each other. Histograms show how your data spreads out. Oh, and if you're looking at distribution patterns, histograms are clutch. Match whatever chart feels right for the story you're trying to tell.
Here's the thing - data storytelling is what separates boring spreadsheets from stuff people actually remember. You gotta give your data a narrative arc, like beginning-middle-end. Otherwise you're just throwing charts at people and hoping something sticks (spoiler: it won't). Start with your main message first, then build everything around that. Guide viewers through the "holy crap" moments instead of making them hunt for insights. It's basically being a tour guide but for numbers. Way more effective than those soul-crushing quarterly reports everyone pretends to read. Connect the dots between your data points so the story flows naturally.
Interactive stuff is a game-changer honestly. Instead of people just staring at your charts, they can actually poke around and find what they need. Hover details, filters, zoom – all that lets users answer their own questions rather than whatever you thought was important. I've seen people find patterns I totally missed, which is pretty cool. Complex data becomes way less intimidating when users can slice it up themselves. Oh, and don't overthink it at first. Start with basic tooltips and simple filtering. You'll see people engage way more and actually get what you're showing them.
Honestly, Tableau's probably your best bet if you're just starting out - their free version is pretty solid for learning. Power BI's another good drag-and-drop option. Python people love matplotlib and seaborn, but that's way more coding involved. D3.js looks amazing for custom web stuff, though I tried it once and wanted to throw my laptop out the window. Google Sheets actually handles basic charts better than you'd expect these days. Start simple with Tableau, then level up once you figure out what you actually need. Just pick something you won't abandon after a week.
Honestly, just think about who's gonna be staring at your chart. Data scientists? Go wild with your fancy violin plots and statistical overlays - they eat that stuff up. But executives? Dude, they want bar charts and line graphs they can glance at for two seconds and understand. The more technical your audience, the more complex you can get. Simple rule I learned the hard way: always show it to someone similar to your actual audience first. If they squint or look confused, you've overcomplicated it. Save yourself the awkward presentation moment!
Don't mislead people - that's the big one. Truncated axes, cherry-picked timeframes, weird scales... all that stuff makes your data lie. Oh and please check if colorblind folks can actually read your charts (I learned this the hard way). Context matters too - give people enough background so they're not guessing what your numbers mean. Cultural bias is sneaky in design choices. Here's what I always do: look at my visualization and think "could someone totally misread this?" If yes, I fix it before hitting send.
Honestly, data viz is a game changer because you can spot patterns and trends in seconds instead of staring at endless spreadsheet rows. Makes decisions so much faster when you're not drowning in numbers. Also, presenting to your boss or stakeholders becomes way less painful - trust me, nobody wants to look at data tables during a meeting. I usually start with basic bar charts or line graphs (nothing fancy), and it's crazy how much clearer everything becomes. Your whole team gets on the same page instantly when they can actually see what the data's telling you.
Dude, annotations are literally everything. Without them, your charts just sit there looking pretty but telling nobody anything useful. I've watched so many people squint at dashboards trying to figure out what the hell they're even looking at - it's painful. Clear axis labels are a must. Call out your key data points. Drop in some context notes to guide people through your story. Quick test: if someone can't get your visualization in 10 seconds without you standing there explaining it, you need way more labels. Trust me on this one.
Honestly, data visualization is a game changer for marketing stories. Skip the boring conversion rate charts – show customer journeys or seasonal patterns instead. Interactive dashboards are killer for client meetings (people love playing with the data themselves, it's weird but true). Infographics work really well on social too. Match your visual style to your brand vibe, obviously. Focus on insights that back up your goals. Oh, and start small – pick one campaign and tell its story from different angles. Way more engaging than spreadsheets full of numbers.
So real-time dashboards are massive right now - everyone wants data that updates instantly. AI insights are getting really good at catching stuff you'd totally miss on your own. Mobile design is critical since we're all glued to our phones anyway lol. Accessibility features are finally becoming standard too, which is about time honestly. Teams want collaborative tools where they can comment directly on charts instead of endless email threads. Interactive storytelling is having a moment. If you're looking to skill up, I'd definitely learn some real-time streaming tools.
Don't wait until you're done to think about accessibility - build it in from day one. Pick colors that work for colorblind folks and bump up your contrast ratios. Here's the thing though: color alone is pretty much useless for conveying info. Throw in some patterns or just label stuff directly. Most charts are a nightmare for screen readers, so maybe include a basic data table too? Oh, and please don't use tiny fonts that make everyone squint. Honestly, just grab an accessibility tool or ask someone with vision issues to take a look - they'll spot problems you'd never notice.
Honestly, I focus on three main things: accuracy (obviously your data needs to be right), how fast people "get it," and what they actually remember afterward. There's this 5-second test I swear by - if viewers can't grab the main point that quickly, something's off. Oh, and if your viz is supposed to help people make decisions, track whether they can actually complete those tasks. But here's what really works: grab a few coworkers who don't know your data and watch them react. The stuff that confuses them? That's exactly what you need to fix. Way better than guessing.
-
Excellent Designs.
-
Use of different colors is good. It's simple and attractive.