

Progress bar chart example of ppt






Try Before you Buy Download Free Sample Product
 Impress Your
Audience
 100%
Editable
 Save Hours
of Time


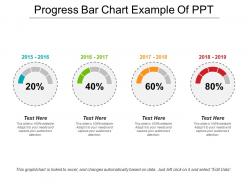
This performance bar PPT presentation is very useful when you wish to make a comparison between the progress rates of various years. This improvement indicator slideshow is a four-staged process and can be used to represent the growth rate of your company for four consecutive years or however it is considerable. It is very important that you know the performance of a company and it becomes easier to know that if you download and use our pre-designed business template. This donut chart graph will also let you know what the current position of your working unit is, and will also help you see whether the set standards are being achieved or not. This excel linked flat design PowerPoint presentation contains four circles each of which represents the performance and growth of the mentioned year above it. So download this charts and bar graph template and grab all the attention without actually making a lot of efforts. Close the debate with our Progress Bar Chart Example Of Ppt. Clear the air of any controversy.
People who downloaded this PowerPoint presentation also viewed the following :
Progress bar chart example of ppt with all 5 slides:
Our Progress Bar Chart Example Of Ppt bring customers to your doors. You will become the destination of choice.


FAQs for Progress bar chart
Okay so first things first - make sure your labels are super readable and the visual hierarchy makes sense. Colors should match your brand but honestly, contrast is way more important than being fancy. I literally always screw up the proportions on my first attempt, but you've gotta keep them accurate to your actual data or people will call BS. Throw in some percentage labels or target markers so nobody has to squint and guess. Skip animations unless you're presenting live - they're just annoying in static slides. Oh and definitely check how it looks at actual presentation size beforehand.
Honestly, progress bars are a game-changer for project presentations. Your audience gets the completion percentages instantly without squinting at those nightmare Gantt charts. Color-code them - green for done, yellow for current work, red for anything behind schedule. What's nice is you can show multiple tasks at once, so everyone sees the full picture right away. Bottlenecks jump out immediately. I've seen people grasp project status in like 10 seconds vs. sitting there for five minutes trying to decode traditional timelines. Way more effective for stakeholders who don't have time for the weeds.
Honestly, it comes down to space and how people read stuff. Horizontal bars are perfect when your category names are long - way more room for labels. Plus we naturally read left to right anyway. Vertical ones work better if you're cramped for width or want that whole "growth going up" vibe (which honestly looks pretty satisfying). One thing though - horizontal makes comparing values way easier since you can just glance across the endpoints. I'd probably stick with horizontal unless you really need vertical for spacing reasons or you're showing something like sales growth where the upward movement actually matters visually.
Colors totally change how people react to progress bars. Green feels like "yes, we're crushing it!" Red screams urgency or problems. Blue's solid for anything corporate - gives off that trustworthy vibe. Yellow catches your eye but honestly feels a bit... cautious? Like a warning sign. Most progress bars I see are just boring gray, which is such a missed opportunity. Match your colors to what you want people to feel - greens and blues for positive stuff, reds for deadlines. Test a few options with real users though, because what looks good to you might not hit the same for them.
Okay so segmented progress bars are perfect when you've got multiple steps or phases to track. Like if you're showing project stages - planning, design, dev, testing - each piece gets its own segment. Way more useful than a regular bar that just says "60% done" because now you can actually see planning is finished, design is mostly there, but development hasn't even started yet. Honestly they just look cooler too. Use them whenever the breakdown is as important as the overall progress. Regular progress bars are fine for simple stuff, but if your users need to know which specific parts are completed or stuck, segmented is definitely the way to go.
Honestly, animated progress bars are so much better than static ones. Your audience actually follows along instead of getting overwhelmed by all the data at once. Each bar filling up gives you perfect moments to pause and explain what happened during that period. There's something weirdly addictive about watching those bars grow – people genuinely pay more attention. I'd stick to 2-3 seconds per segment though. Any faster and it's just chaos, any slower and you'll lose them. Oh, and it lets you build suspense if you're revealing something dramatic!
Don't make your progress bars super skinny - nobody can read those things quickly. Keep your scales consistent between bars, otherwise people get confused comparing them. Avoid cramming tons of categories together too. Those 3D effects? Ugh, they're the worst and just mess up your data. Always start your scale at zero or you'll accidentally mislead people about the actual differences. Simple colors work best, and yeah, label everything clearly. I learned that one the hard way! Stick to these basics and you'll actually have something people can understand instead of squinting at.
Honestly, progress bars blow pie charts out of the water for completion stuff. Way easier to read quickly. Pie charts just make people squint and do math in their heads - who has time for that? With progress bars, you get that instant "okay, we're 60% done" feeling. Line graphs are cool for trends but terrible when you just need a status check. Your team can glance at a bunch of progress bars and immediately know what's on track versus what's lagging. Trust me, use them for project updates or goal tracking. Everyone will actually understand your data for once.
Honestly, Tableau and Power BI are your best bet for this stuff - both have solid progress bar widgets and look actually professional. Excel's not bad either if you mess around with conditional formatting (I probably use it way more than I should lol). D3.js gives you crazy control but you'll need to code. Google Data Studio works great if you're already using their other tools and it's free. My advice? Just use whatever your team's already familiar with. You'll save yourself the headache of learning new software when the one you know probably works fine.
Progress bars are perfect for building tension - people immediately see the gap between where you are and where you need to be. I always drop them in right before big reveals or when I'm showing how something evolved over time. They work great for before/after stuff too. The whole "filling up" thing just feels satisfying, you know? You can color-code different categories which gets fancy fast. Oh, and definitely animate them while you're presenting - let each bar build as you talk through the numbers. Way more engaging than static charts.
Be super specific with your labels - "Q3 Sales Target Progress" beats just "Progress" every time. Include the actual numbers too, not just pretty bars (trust me, people will ask for them anyway). Color coding helps if you've got multiple bars, and throw in some milestone markers or target lines for context. Here's what drives me nuts though - labels that are impossible to read because they're crammed in tiny spaces. Just... don't. Make sure someone can glance at your chart and get it in 5 seconds without playing guessing games.
Progress bars are honestly your best bet for showing business targets. Sales goals, project milestones, KPIs - whatever you're tracking. People get it immediately instead of staring at spreadsheet numbers trying to do math in their heads (which never goes well). Like if you're at 30% vs 80% of your revenue goal, the visual difference is obvious. I'd definitely include the actual numbers too though, not just the bars. Oh and color coding helps a ton - green when you're crushing it, yellow when things are getting sketchy. Way more effective than traditional charts for this stuff.
Dude, interactive progress bars are game-changers. People can actually click around and dig into the data instead of just staring at a boring static chart. When they hover over different sections or filter by time periods, they stay way more focused - honestly, it's like giving them something to do with their hands. Perfect for showing project timelines or hitting goals during presentations. Makes all that complex progress stuff way easier to digest. Try breaking things down by department or date ranges that people can click on. Trust me, your team will actually pay attention instead of checking their phones.
Okay so for progress bars, you'll want to make them super obvious for everyone. Slap percentage labels right on the bars and use colors that make sense - green for good, red for behind. Then add simple text like "3 out of 5 milestones done." Icons or checkmarks help too, especially for people who aren't data nerds. Oh, and always include a legend! Trust me, it prevents so many confused emails later. The whole point is giving people different ways to "get it" - some folks read numbers, others need colors or symbols. Make it redundant but in a helpful way.
Progress bars are honestly perfect for tracking goals because everyone gets what "50% complete" means instantly. You can use them for literally anything - sales targets, workout goals, project deadlines, whatever you're trying to hit. I've found they work best when you update them regularly so the progress stays visible. The cool thing is they create this weird psychological momentum. People get oddly motivated watching that bar fill up! Set it up for individual stuff (like "make 50 client calls this month") or team goals. Just make sure your goal is actually measurable first, then keep updating it so it doesn't become one of those forgotten spreadsheets.
-
Out of the box and creative design.
-
Easy to edit slides with easy to understand instructions.