

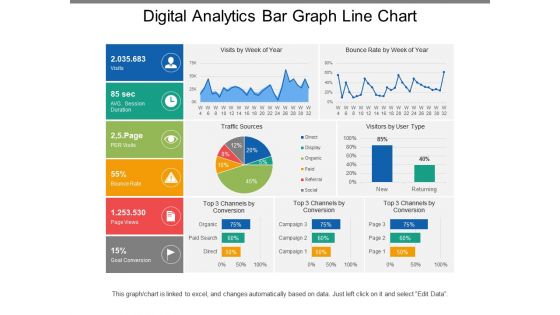
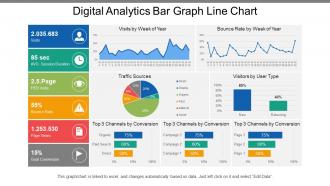
Digital analytics bar graph line chart





Try Before you Buy Download Free Sample Product
 Impress Your
 Audience
 100%
100% Editable
 Save Hours
 of Time


Guard against deception with our Digital Analytics Bar Graph Line Chart. They enable access to the full facts.
People who downloaded this PowerPoint presentation also viewed the following :
Digital analytics bar graph line chart with all 6 slides:
Have a charming evening with our Digital Analytics Bar Graph Line Chart. They create an air of enchantment.
FAQs for Digital analytics bar
Honestly? Just focus on the stuff that actually makes you money - conversion rates, customer acquisition cost, lifetime value. That's where the real insights are. Sure, traffic numbers like sessions and pageviews look nice on reports, but they don't tell you if people are actually buying anything. Bounce rate and time on page are solid for understanding how users behave on your site. Pick maybe 3-5 metrics max that connect to your actual goals. I made the mistake early on of tracking everything and got overwhelmed by data that didn't matter. Get those core metrics down first, then add more as you figure out what's actually useful.
Check your bounce rates and see where people bail out - that's your starting point. Heat maps are seriously worth the money because they show exactly what users click on (or ignore completely). I always look for patterns first, like if tons of people dump their carts at checkout or leave from the same page. Time on page tells you a lot too. Once you spot the problem areas, fix the obvious stuff - slow pages, confusing menus, buttons that don't look clickable. Don't try to fix everything at once though. Pick one issue and test it properly before moving on.
Oh this is actually pretty straightforward! Descriptive analytics just shows what already happened - like "you got 10K website visits last month." Predictive takes that data and forecasts what's coming - "you'll probably hit 12K next month." Then prescriptive is where it gets interesting - it tells you exactly what to do about it, like "post 30% more blogs to reach 15K instead." Most people get obsessed with those pretty descriptive dashboards (guilty as charged lol) but honestly? The money's in prescriptive stuff that actually helps you make decisions instead of just staring at charts.
Look, A/B testing is where analytics actually gets useful instead of just being a bunch of charts. You're literally proving what works rather than making educated guesses. Test different page versions, emails, whatever - see which one gets better results. Honestly? It's addictive when you find a clear winner. Start by using your current data to spot problems or opportunities first. Then build tests around those insights. Don't go crazy though - test one thing at a time. Like, try button colors before you redesign your entire homepage and confuse yourself.
Dude, data viz is honestly such a lifesaver. Those endless spreadsheet rows? Turn them into charts and suddenly patterns just pop out at you. I used to waste so much time squinting at numbers trying to find trends that are obvious in a simple line graph. Bar charts and line graphs are your best friends when you're starting out - don't jump straight to the fancy heatmaps (though those are pretty cool). With dashboards, you'll instantly see which campaigns actually work, where people bail on your site, what's driving sales. It's like having x-ray vision for your data.
Start with Google Analytics - it's free and covers most of what you need. Facebook/Instagram Insights too if you're posting there. Google Search Console is clutch for SEO stuff. Honestly, so many businesses blow money on fancy dashboards when they don't even use the basic tools properly. Pick like 3-5 metrics that actually move the needle for your goals. Don't get lost in the weeds tracking everything under the sun. Oh, and actually look at your data weekly - even just 30 minutes makes a huge difference in spotting what's working.
Okay so basically you want to focus on consent, transparency, and not hoarding data. Don't be like those annoying cookie banners that nobody reads - actually explain what you're collecting and why in plain English. Grab only the data you legitimately need, not everything you can get your hands on. Be upfront about storage time and who's accessing it. Oh and watch out for bias creeping into your analysis, especially if your findings could screw over certain groups of users. Honestly, just ask yourself: would I be cool with a company pulling this stuff with my data? If not, then don't.
So here's the deal - you basically set up tracking events in Google Analytics (or whatever you use) that match your funnel stages. Like page views for awareness, form submissions for consideration, purchases for conversions, that stuff. The real magic happens when you can see exactly where people bail out of your funnel. Define your stages first, then work backwards to figure out what events to track. Your dashboard will show you the whole user journey so you can fix whatever's broken. Honestly, it's pretty satisfying once you get it dialed in and can actually see what's working.
Honestly, GA4's real-time reports are probably your best bet since you likely already have it running. Adobe Analytics is amazing but costs a fortune - only worth it if you've got serious budget. Mixpanel's great for tracking specific events, and Hotjar... man, I literally live in that dashboard during big launches. The behavior stuff is addictive to watch. Don't fall for tools that say they're "real-time" but actually update every 5 minutes. That's useless when you need quick data. Start with GA4, see what gaps you have, then add other tools based on what your team actually cares about measuring.
Okay so digital analytics shows you who's actually visiting your site and what they're into. You can break people down by how they behave, where they're from, interests - stuff like that. Like if someone keeps browsing laptops, you show them laptop deals. Or send blog content based on what pages they hit most. Pretty neat how specific you can get with it, honestly. First thing though - make sure your tracking's set up right. Then use that data to build audience segments in your CMS or whatever ad platform you're using. I'd start with just one or two clear groups and expand from there.
Oh man, the biggest one is mixing up correlation with causation - two things moving together doesn't mean one caused the other. Also watch out for vanity metrics that look cool but are basically useless (page views, ugh). Don't mess with date ranges just to make your data look better. Statistical significance beats flashy percentage changes every time. Seasonality and campaigns can totally throw off your analysis too, which honestly trips people up more than it should. Before diving in, ask yourself what decision you're actually trying to make. Keeps you focused on stuff that matters.
Don't just track likes and shares - that stuff's basically meaningless. You need to connect your social metrics to real business results. Pull your engagement rates, click-throughs, and conversion data into your main dashboard with website traffic and sales numbers. That's how you see the whole customer journey. Most people get trapped looking at vanity metrics which honestly drives me crazy because it's so pointless. Social should drive awareness at the top and help with conversions later. Oh, and set up UTM parameters for your social links - otherwise you can't track how people actually move through your funnel.
Your mobile optimization is gonna save your analytics, trust me. Bounce rates drop when people aren't fighting with slow-loading pages on their phones. Session time goes up too because users actually stick around instead of bailing. Google's mobile-first thing means if your site sucks on mobile, your search rankings tank - which honestly makes sense since everyone's on their phone now. Even your data quality improves since people aren't rage-quitting halfway through sessions. Check your mobile speed scores in Search Console first, that'll show you where you're bleeding users.
Okay so basically you want to connect your sales/leads back to whatever campaign brought them in. Google Analytics is your friend here - set up goals for purchases, signups, whatever matters to your business. Then just do the math: how much did you spend vs. how much revenue came back? I keep a simple spreadsheet (nothing fancy) with campaign costs in one column, revenue in another. Customer acquisition cost is huge too - like, how much you're paying to get each new customer. Honestly I'd start with just 2-3 metrics or you'll go crazy trying to track everything. Lifetime value's important but maybe add that later once you've got the basics down.
SQL is absolutely essential - you can't get around learning that for pulling data. Google Analytics, Tableau, maybe some Python if you're feeling ambitious. But honestly? The communication piece is what separates good analysts from great ones. I've watched so many smart people struggle because they can't translate their findings into plain English for executives. Statistics helps too, so you're not just grabbing random numbers without context. Oh, and understanding the actual business side matters more than people think. Don't try to learn everything at once though - pick one thing and get really good at it first.
-
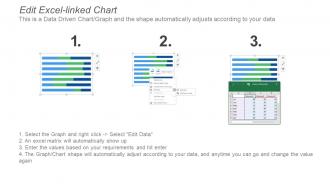
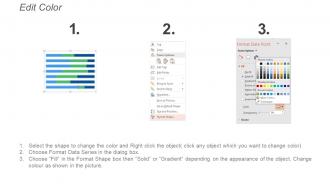
Easy to edit slides with easy to understand instructions.
-
It saves your time and decrease your efforts in half.