

Progress bar template powerpoint slide






Try Before you Buy Download Free Sample Product
 Impress Your
Audience
 100%
Editable
 Save Hours
of Time


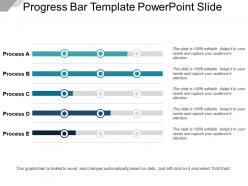
Track your progress by providing it a visual representation using Progress Bar Template Powerpoint Slide. With the help of progress bar PPT slide you can keep a track of the different tasks taking place in your organisation. The PowerPoint slide consists of five progress bars depicting different statuses of different tasks. It makes it easy for a team find out the tasks lagging behind so that the work can be done keeping a deadline in the mind. A progress bar uses a linear function to explain the level of progress made. Just add the tasks along with the progress bars according to your company’s profile and you will be ready with your presentation in no time. This self-explanatory PPT slide will make your task of providing the insights of work being done to your company very easy. Therefore, download this PPT template now and understand the progression of your organization.
People who downloaded this PowerPoint presentation also viewed the following :
Progress bar template powerpoint slide with all 5 slides:
Ensure the gullible don't get cheated with our Progress Bar Template Powerpoint Slide. Identify any attempts at fraud.
FAQs for Progress bar
Honestly, just focus on making it big enough that people can actually see it - can't tell you how many presentations I've sat through squinting at microscopic progress bars. You want a clear visual like filled bars or those segmented circles, plus percentage labels so it's obvious. Throw in some milestone markers if they make sense for your data. Color-wise, stick with your presentation theme but keep it simple - no crazy animations that'll distract everyone. Oh and definitely give it a clear title explaining what you're tracking. Always check how it looks in presentation mode first because what looks good on your laptop might be terrible projected.
Honestly, progress bars are such a game changer for presentations. Your audience can actually see where they are instead of mentally checking out halfway through. Like when you're watching a movie and need to know how much time is left? Same thing. People focus way better when they know "okay, three more sections" versus wondering if you'll talk forever. You can build up anticipation for the good stuff too. Pro tip - just add it to your master slide so it updates automatically. Trust me, your audience will thank you for not keeping them in the dark about timing.
First thing - make sure people can actually read it from the back row. Sounds obvious but you'd be surprised how many presentations fail this basic test. Keep your colors consistent with your brand and create good contrast between finished vs remaining sections. Skip the fancy animations - they're honestly just distracting most of the time. Your text labels should be short and positioned so they don't look all cramped together. Think about who you're presenting to though. Executives usually want something clean and minimal, but creative teams can handle more visual personality. Oh, and definitely test it on the actual screen beforehand since things scale weird sometimes.
Definitely go high-contrast with your progress bars! Dark blue on light gray works great, or green against white. People need to actually see it from the back of the room, you know? Skip red/green combos - colorblind folks will thank you. Plus red feels kinda harsh for progress anyway. Blue or teal are way more encouraging. The filled part has to really pop against the empty section. Here's what I do: step back from your screen and squint a bit. Can you still tell how much progress there is? If yeah, you're good to go.
Progress bars are way more important than people think! Smooth, modern ones make everything feel professional and seamless. But those chunky segmented ones? Actually genius for breaking big projects into bite-sized pieces. I've been really into animated fills lately - there's something so satisfying about watching them move. Color psychology plays a huge role too. Blues and greens feel steady and reliable, while red screams urgency (or problems). Don't forget about font size and spacing if you're presenting to a room. Just match the vibe to your audience and project style.
Honestly, progress bars are clutch for presentations. Your audience gets to see where you are and what's still coming - and trust me, people always want to know how much longer they're stuck there lol. The animation part keeps things visually interesting instead of just staring at static slides. Makes everything look way more professional too. I'd throw in some entrance animations that match when you switch sections. Keeps the whole thing flowing smoothly. Way better than boring bullet points, and it actually helps people stay focused since there's always something subtle happening on screen.
Oh totally! Progress bars work great with other stuff - icons, timeline markers, photos, whatever. I actually think they look way better when they're part of a bigger design instead of just floating there alone. You can drop them into infographics or process diagrams pretty easily. Just make sure your colors and fonts match so it doesn't look messy. Pro tip: group everything together (the bar, text boxes, related charts) so when you move one thing, it all moves together. Saves you from that annoying thing where everything gets misaligned.
Use progress bars when you've got a longer presentation - like training sessions, workshops, or those multi-part sales decks. People get weird when they don't know how much content is left (honestly, who doesn't?). Super helpful for complex topics that build on each other. Your audience will thank you for showing whether they're halfway done or almost finished. Don't bother with short decks under 10 slides. But anything over 15-20 slides? Definitely add one. Oh, and they're clutch for presentations with multiple sections - keeps everyone oriented.
Definitely add alt text that spells out the exact percentage - like "60% complete, phase 3 of 5." High contrast colors are your friend here. Those pretty pastels? Terrible for accessibility. Put the actual numbers right on the slide too - honestly it helps everyone, not just people using screen readers. Don't make people guess based on how full the bar looks. Text labels are clutch for screen readers since they can't interpret visual stuff. Try this: close your eyes and see if you can still understand where things stand. If not, you need more descriptive text.
Just use rectangles and the alignment tools - seriously, they make spacing so much easier. Insert your rectangle shapes for each progress segment, then hit up Align & Distribute to get them perfectly spaced. Format Painter is a lifesaver for copying styles across multiple bars without going insane. Oh, and if you're presenting this live, the animation pane lets you do those cool fill-in effects. Group everything once you're done so you don't accidentally move stuff around later. Make one solid template first, then just copy it to other slides.
Oh totally! Reading direction matters way more than you'd think - Arabic and Hebrew folks scan right-to-left, so our normal progress bars can feel backwards to them. Colors are tricky too. Red means danger here but it's actually lucky in China (go figure). Green isn't universal either, which blew my mind honestly. Some cultures want tons of detail and milestones. Others prefer super clean designs. I'd definitely run it by coworkers from those regions first - saves you from any awkward moments during the actual presentation. Trust me on that one.
Don't overcomplicate your progress bars or cram like 20 steps onto one slide. Clean design wins every time. Your audience needs to instantly see where you are and what's next - if they're squinting and trying to decode it, you've already lost them. Consistent colors help too. Oh, and please don't just slap random percentages on there to look professional! Tie everything to actual milestones that matter. Label each step clearly. I've seen way too many presentations where people get creative with progress bars and it just confuses everyone.
Yeah, definitely put it at the top - that's where your eyes go first anyway. I've sat through way too many presentations where they stuck the progress bar at the bottom and it's completely pointless. Side placement works if your content's narrow, but never put it in the middle where it fights with your text. Bottom's okay as backup, just make it big enough to actually see. Quick test: step back from your screen and see if you can instantly tell where you are in the deck. If not, move it somewhere more obvious.
Yeah, totally works! I've done this before with PowerPoint progress bars - pulled them into Figma and Tableau no problem. Don't try to copy the actual PowerPoint objects though, that gets messy. Instead, grab the colors, proportions, and overall styling. Then just recreate the look in whatever platform you're using. Export elements as PNGs if you need to. Honestly, PowerPoint has some surprisingly decent design templates these days. The trick is adapting how the progress indicators work for your new format - dashboards need different hierarchy than a presentation slide, you know?
Just duplicate your slide at different progress levels - like 25%, 50%, 75%, done. Then jump between them as you present. Don't go crazy with more stages though, it gets annoying to track. I'd use slide sorter view to keep everything organized. Practice the transitions beforehand because accidentally clicking too far ahead looks super awkward (trust me on this one). Oh, and throw in a subtle animation between the updates - makes it feel way more natural instead of these jarring jumps. The whole point is making it seamless so people focus on your content, not the progress bar mechanics.
-
Awesome use of colors and designs in product templates.
-
The content is very helpful from business point of view.