

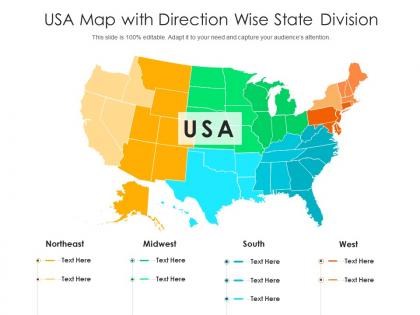
Usa map with direction wise state division




Try Before you Buy Download Free Sample Product
 Impress Your
 Audience
 100%
100% Editable
 Save Hours
 of Time


Our USA Map With Direction Wise State Division are topically designed to provide an attractive backdrop to any subject. Use them to look like a presentation pro.
People who downloaded this PowerPoint presentation also viewed the following :
Usa map with direction wise state division with all 2 slides:
Use our USA Map With Direction Wise State Division to effectively help you save your valuable time. They are readymade to fit into any presentation structure.
FAQs for Usa map with direction
The USA's directional regions are defined by mountain ranges like the Rockies and Appalachians, major river systems including the Mississippi and Colorado, coastal plains along Atlantic and Pacific shores, and vast interior plateaus and basins. These geographical features create distinct regional characteristics that influence economic development, population distribution, and resource allocation, with many organizations leveraging this geographical diversity for strategic market positioning and operational efficiency across different directional zones.
Dividing the USA into directional regions—North, South, East, West, and Central—enhances geographic understanding by organizing complex spatial relationships, climate patterns, cultural characteristics, and economic zones into manageable frameworks. This systematic approach enables students, businesses, and policymakers to analyze regional trends, migration patterns, and resource distribution more effectively, ultimately delivering clearer insights for strategic planning and educational comprehension.
Directional mapping enhances emergency response strategies by enabling faster route optimization, resource allocation, and evacuation planning across diverse geographical regions. Through real-time directional data, emergency services streamline coordination between states, minimize response times, and deliver more effective disaster management, with agencies like FEMA and state emergency departments finding that strategic mapping ultimately improves citizen safety and operational efficiency.
Northern states developed through colonial trade routes, industrial manufacturing, and dense European settlement patterns, while southern states emerged from plantation agriculture, slavery-dependent economies, and scattered rural settlements. These contrasting foundations created distinct political structures, population distributions, and economic frameworks that shaped state boundaries, with northern states emphasizing commerce and manufacturing versus southern agricultural economies.
Directional USA state maps enable demographic analysis by visualizing population density, migration patterns, age distributions, and economic indicators across geographic regions through color coding, heat mapping, and overlay features. These maps help researchers, businesses, and policymakers identify regional clusters, track population shifts between states, and correlate demographic changes with geographic factors, ultimately delivering strategic insights for market expansion and resource allocation decisions.
Climate significantly differentiates eastern and western US states through precipitation patterns, temperature variations, seasonal consistency, and natural disaster frequency, with eastern states experiencing higher humidity and distinct seasons. These climatic differences drive regional economic specializations, from eastern agriculture and manufacturing to western technology and tourism sectors, ultimately shaping population distribution, infrastructure development, and competitive advantages across diverse geographic markets.
Cultural differences between northern and southern states reflect distinct historical, economic, and social developments, with northern states typically emphasizing individualism, faster-paced business environments, and direct communication styles, while southern states prioritize relationship-building, hospitality, and community connections. These regional variations significantly impact business practices, with many organizations finding that understanding local cultural nuances enhances customer engagement, operational efficiency, and market penetration strategies across different geographic territories.
The Midwest's economic strengths include manufacturing dominance, agricultural production, lower operational costs, and strong logistics infrastructure, while the West Coast leads in technology innovation, entertainment industries, and international trade. Both regions offer complementary advantages, with many organizations finding that Midwest manufacturing pairs strategically with West Coast innovation hubs, ultimately delivering diversified supply chains and competitive market positioning.
Tourism trends analyzed through directional perspectives reveal distinct regional patterns, with Western states emphasizing outdoor recreation and national parks, Southern states focusing on cultural heritage and warm-weather destinations, Northeastern states leveraging historical attractions and urban experiences, and Midwestern states promoting agricultural tourism and family-friendly activities. These directional groupings enable tourism boards to develop targeted marketing strategies, optimize seasonal campaigns, and create cross-regional partnerships, ultimately delivering more effective resource allocation and enhanced visitor experiences across complementary geographic markets.
**INPUT**: What tools or software can be used to create an interactive USA state map by direction? **OUTPUT**: Interactive USA state maps can be created using Tableau, ArcGIS Online, D3.js, Google Maps API, and PowerBI, each offering robust directional visualization capabilities. These platforms enable organizations to streamline geographic analysis, enhance data presentation, and deliver dynamic user experiences, with many businesses finding that interactive mapping ultimately drives better decision-making and competitive advantage.
The directional distribution of US natural resources shows distinct regional patterns, with western states rich in minerals and energy reserves, southern states abundant in oil and natural gas, and northern states featuring forests and freshwater resources. This geographic variation enables strategic resource allocation and interstate commerce, with many organizations finding that directional mapping helps identify supply chain opportunities, optimize logistics networks, and develop regional partnerships, ultimately delivering competitive advantages through enhanced operational efficiency.
State-by-direction mapping reveals crucial voter migration patterns, demographic shifts, and regional political alignments that significantly influence campaign strategies and resource allocation. Political campaigns leverage these geographic insights to identify swing regions, optimize advertising spend, and tailor messaging for directional voting blocs, with many strategists finding that northern-southern and coastal-inland divisions often predict electoral outcomes more accurately than traditional state-by-state analysis.
Educators can utilize directional USA state maps to teach spatial relationships, regional clustering, and geographic patterns through interactive exercises like cardinal direction games, neighboring state identification, and regional comparisons. These visual tools enhance geography lessons by enabling students to understand how states connect across different directions, practice map reading skills, and develop stronger spatial awareness, ultimately making American geography more engaging and memorable for diverse learning styles.
**INPUT**: What visual elements are most effective when designing a presentation on a USA state map by direction? **OUTPUT**: Effective visual elements include directional arrows, color-coded regions, compass indicators, geographic legends, and clear labeling systems that highlight spatial relationships. These design components streamline audience comprehension by establishing visual hierarchy, emphasizing directional flow, and creating intuitive navigation patterns, with many organizations finding that strategic color schemes and consistent iconography ultimately enhance geographic storytelling and data retention.
Analyzing transportation networks directionally involves examining highway corridors, rail lines, shipping routes, port connections, and interstate commerce flows by geographic orientation. This approach enables logistics companies, urban planners, and supply chain managers to optimize freight movement, reduce transportation costs, and identify bottlenecks, ultimately delivering enhanced operational efficiency and strategic routing advantages across regional markets.
-
Use of icon with content is very relateable, informative and appealing.
-
Excellent Designs.
-
Design layout is very impressive.