


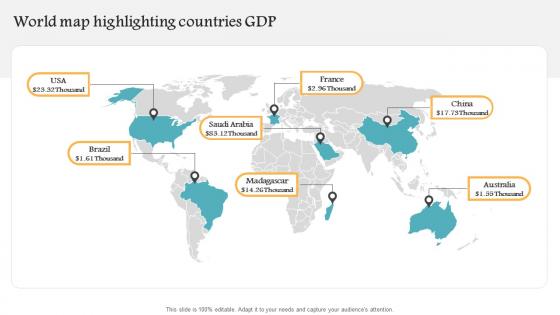
World Map Highlighting Countries Gdp




Try Before you Buy Download Free Sample Product
 Impress Your
Audience
 100%
Editable
 Save Hours
of Time


Our World Map Highlighting Countries Gdp are topically designed to provide an attractive backdrop to any subject. Use them to look like a presentation pro.
People who downloaded this PowerPoint presentation also viewed the following :
World Map Highlighting Countries Gdp with all 9 slides:
Use our World Map Highlighting Countries Gdp to effectively help you save your valuable time. They are readymade to fit into any presentation structure.








FAQs for World Map
The top five countries by GDP are the United States, China, Japan, Germany, and India, representing the world's largest economies by total output. These economic powerhouses drive global trade, innovation, and investment flows through their massive consumer markets, advanced manufacturing capabilities, and financial systems, ultimately delivering significant influence over international business strategies and competitive positioning across industries.
GDP per capita varies significantly among leading economies, with countries like Luxembourg, Switzerland, and Norway typically exceeding $70,000 annually, while major powers like the US and Germany range between $45,000-65,000. These disparities reflect differences in population size, resource distribution, and economic structure, with smaller nations often achieving higher per-capita wealth through specialized industries, ultimately enabling targeted investment strategies and market positioning for multinational organizations.
Primary factors influencing GDP growth in emerging markets include foreign direct investment, infrastructure development, technological adoption, human capital enhancement, and natural resource utilization. These elements work synergistically by attracting international partnerships, streamlining trade corridors, and boosting productivity across sectors like manufacturing and services, with many economies finding that strategic investment in education and digital infrastructure ultimately delivers sustained competitive advantage.
Currency fluctuations impact GDP through trade balances, foreign investment flows, and international competitiveness measures. When currencies strengthen, exports become more expensive while imports cost less, affecting manufacturing and retail sectors differently, while currency weakness can boost export-driven industries like agriculture and technology, ultimately delivering mixed economic outcomes that require strategic policy responses.
Government policy stimulates GDP growth through fiscal measures like infrastructure investment and tax incentives, monetary policies including interest rate adjustments, regulatory reforms that enhance business efficiency, and strategic trade policies. These approaches work together to boost consumer spending, encourage business expansion, and attract foreign investment, with many countries finding that coordinated policy frameworks deliver sustained economic growth and competitive positioning in global markets.
GDP serves as an indicator of economic health by measuring total production output, employment levels, consumer spending patterns, and business investment activity within a country's borders. Through tracking quarterly changes, policymakers and investors assess economic growth trajectories, identify recession risks, and compare performance across nations, with many financial institutions finding that consistent GDP growth signals stable markets and investment opportunities.
GDP limitations include excluding unpaid work, income inequality, environmental costs, quality of life factors, and underground economies. While GDP measures economic output effectively, countries like Bhutan and New Zealand increasingly adopt alternative metrics such as Gross National Happiness and Well-being Budgets, recognizing that true prosperity encompasses social cohesion, sustainability, and citizen welfare alongside economic growth.
GDP comparisons between developed and developing nations reveal significant disparities in economic scale, per capita income, and structural composition. Developed countries typically show higher GDP per capita through advanced manufacturing and services, while developing nations often demonstrate faster growth rates but lower absolute figures, with many transitioning from agriculture-based economies toward industrial and service sectors, ultimately creating opportunities for strategic investment and partnership.
International trade significantly impacts a country's GDP through exports, imports, foreign investment flows, and enhanced economic efficiency. When countries export goods and services, this directly adds to GDP, while strategic imports can lower production costs and improve competitiveness, with many nations finding that trade openness ultimately delivers higher growth rates and economic resilience.
Environmental sustainability can be integrated into GDP calculations through green accounting methods, natural capital valuation, carbon pricing mechanisms, resource depletion adjustments, and ecosystem service measurements. These approaches enable countries to account for environmental costs and benefits alongside traditional economic output, with nations like Costa Rica and Bhutan finding that sustainable GDP metrics deliver more comprehensive economic assessments and long-term competitive positioning.
High GDP growth rates can strain social fabric through increased inequality, rapid urbanization displacing communities, and widening gaps between economic classes, while simultaneously creating opportunities for improved living standards, enhanced education access, and better healthcare systems. Many developing nations find that managing this growth strategically through inclusive policies helps preserve social cohesion while delivering economic advancement and competitive positioning.
GDP and unemployment rates typically show an inverse correlation, where higher economic growth correlates with lower unemployment through increased business expansion, job creation, and consumer spending. However, this relationship varies significantly across countries due to labor market policies, economic structures, and industrial composition, with developed nations like Germany and Japan often maintaining lower unemployment during growth periods, while emerging economies may experience different patterns based on their specific economic transitions and structural factors.
Stagnant economies can boost GDP through infrastructure investment, education and skills development, regulatory reform, innovation incentives, and trade liberalization. These strategic approaches enhance productivity by attracting foreign investment, creating jobs, and fostering entrepreneurship, with many countries finding that combining fiscal stimulus with structural reforms ultimately delivers sustainable growth and competitive advantage.
Technological advancements influence GDP growth by enhancing productivity, streamlining operations, and enabling new industries to emerge. These innovations revolutionize sectors like manufacturing, financial services, and healthcare through automation, data analytics, and digital platforms, ultimately delivering increased efficiency, reduced costs, and competitive advantages that drive sustained economic expansion.
A declining GDP signals reduced economic output, lower employment rates, decreased consumer spending, diminished business investments, and potential fiscal challenges for government programs. While this presents immediate concerns for living standards and business growth, it often prompts strategic policy responses like stimulus measures, infrastructure investments, and economic diversification initiatives, with many countries finding that targeted interventions can accelerate recovery and strengthen long-term competitiveness.
-
I was mind-blown by the services that SlideTeam provided me. Thanks a ton!
-
Excellent design and quick turnaround.