


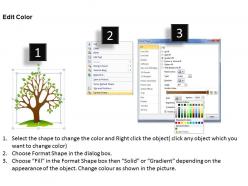
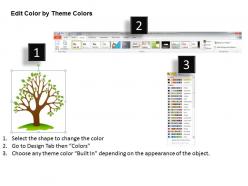
1813 business ppt diagram model of decision tree powerpoint template




Try Before you Buy Download Free Sample Product
 Impress Your
 Audience
 100%
100% Editable
 Save Hours
 of Time


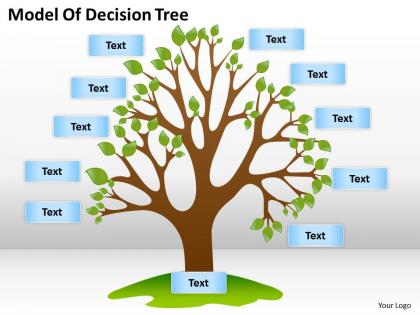
A Decision Tree PowerPoint Template effectively communicates the plans or the strategy of achieving particular business goals. These classification model slides, literally split and divide the data in a way that it display the message into the branch like segments clearly. Not only this, decision tree algorithm PPT template is also perfect to present the classifications, strategies or other presentations because these decision tree graphics serve as a model of computation or communication to explain the concept in a better way. Above all, these classification and regression tree icons can also be added to the flow charts and make your presentation even more effective. Great ideas deserve a powerful launch. Our 1813 Business Ppt diagram Model Of Decision Tree Powerpoint Template will give them the thrust they need.
People who downloaded this PowerPoint presentation also viewed the following :
1813 business ppt diagram model of decision tree powerpoint template with all 5 slides:
Our 1813 Business Ppt diagram Model Of Decision Tree Powerpoint Template deliver on your every demand. They are glad to come to your aid.
FAQs for 1813 business ppt diagram model of decision
So decision trees have three parts: root nodes (where you start with all your data), internal nodes (where splits happen based on features), and leaf nodes (your final answers). Basically it's like playing 20 questions with your dataset - you keep asking yes/no questions about features until you get to a prediction. The tricky part? Early splits matter way more than you'd think. They totally shape what happens below them. When you're building one, focus on finding features that create really clean separations at the top. Those early decisions cascade down and pretty much determine how well your whole tree performs.
So decision trees split on these two variable types pretty differently. With categorical stuff like "color," it'll either make separate branches for red/blue/green or group some categories together. Continuous variables are where it gets more interesting though - the algorithm tests a bunch of threshold points to find the sweet spot, like "age ≤ 30" vs "age > 30." The math changes too. Categorical splits use things like Gini impurity across all the categories. For continuous ones, it's basically testing every possible cutoff point until it finds what works best. Oh, and you don't need to encode categorical variables beforehand like other algorithms require, which is nice.
Honestly, decision trees are perfect when you need to actually explain your predictions to people - think healthcare or finance where someone's gonna ask "why did you flag this patient?" Mixed data types? No problem, they handle categorical and numerical stuff without any preprocessing headaches. debugging is way less painful than trying to figure out what went wrong in some deep learning model (been there, not fun). They're also great for figuring out which features actually matter. If your stakeholders need to trust and understand what's happening under the hood, definitely go with decision trees first.
So there's two main ways to prune decision trees. Pre-pruning stops the tree early using rules like max depth or minimum samples. Post-pruning builds the whole tree first, then cuts back the weak branches. Honestly, you definitely need pruning though - without it, trees just memorize your training data perfectly but crash and burn on new stuff. It's basically like cramming for a test instead of actually learning. Post-pruning with cost complexity usually works better since you get the full picture before deciding what to axe. I'd start simple with something like max_depth=5, then maybe try post-pruning later if you need better results.
Honestly, don't just look at accuracy - it's pretty useless if your data's imbalanced. Confusion matrices show you exactly where things go wrong. Calculate precision, recall, and F1 for each class too. ROC curves are clutch for seeing how well it separates classes. Decision trees overfit like crazy (seriously, they memorize everything), so cross-validation is a must. Check which features it's actually using - sometimes trees latch onto random stuff that makes no sense. K-fold validation across different splits gives you the real picture of performance.
So entropy and Gini impurity are just ways to measure how mixed up your data is at each split point. High values = total chaos with all different classes jumbled together. Low values = nice clean separation. Your decision tree uses this to pick the best questions that'll reduce the mess the most (that's called information gain). Picture sorting a junk drawer - you want each compartment as organized as possible afterward. Gini's usually the default since it calculates faster, though honestly I've seen entropy work better on some datasets. Worth testing both if you've got time.
So basically your tree is memorizing instead of actually learning - it's making crazy specific rules for every weird data point. Pruning helps by cutting useless branches. You can also set max depth or require minimum samples per leaf. Random forests are solid since they average out multiple trees. Honestly, cross-validation is your best friend for catching this stuff early. I usually start simple with constraints then slowly ramp up complexity. There's definitely a sweet spot where it clicks, but finding it takes some trial and error.
Definitely start by pruning those crazy deep branches - nobody can follow that mess. Graphviz is amazing for visualizing the tree structure, makes the whole decision flow super obvious. Feature importance plots will show you which variables actually drive the splits. Also worth documenting the main decision rules in plain English, especially for paths that come up a lot. Oh, and set max_depth and min_samples_split parameters early so you don't end up with overly complex trees. Honestly, visualization should be your first move - once you can see what's happening, explaining it to stakeholders becomes way easier.
So decision trees are super unstable and overfit like crazy, right? Random Forest fixes that by building tons of trees instead of just one. Each tree gets trained on different random chunks of your data and features. When you make predictions, all the trees vote and you average their answers. It's honestly pretty genius - like getting advice from a whole group instead of one person who might be wrong. The best part? You don't have to mess around with hyperparameters much. I've seen it work well on most classification stuff I've tried.
Hey! Decision trees are crazy prone to overfitting - they'll just memorize your training data instead of actually learning anything useful. Small changes in your dataset can totally restructure the whole tree too, which makes explaining results to your boss a nightmare. They also suck at handling linear relationships and get biased toward features with lots of categories. Honestly, I'd just skip straight to Random Forest or XGBoost - you get the same interpretability but without all the headaches. Way more reliable in my experience.
Decision trees are super practical for loads of stuff. Healthcare uses them for diagnosis - like "chest pain + over 50? Get an EKG." Banks rely on them for credit scoring and catching fraud since you can actually trace the reasoning. Insurance companies do risk assessment with them too. The best part? Regular people can follow the logic, unlike those black box models that just throw numbers at you. Honestly, they're perfect when non-tech folks need to understand and explain decisions. I'd start small with something straightforward in whatever field you're working in.
Definitely track the usual suspects like precision, recall, F1-score - though accuracy alone is pretty useless if your data's wonky. Business metrics are where it gets real though: ROI, conversion rates, whatever actually moves the needle for your stakeholders. Since you went with decision trees, make sure people can actually understand the logic (that's the whole point, right?). Oh, and here's something nobody talks about enough - track whether users actually follow the model's advice. Best accuracy in the world doesn't matter if everyone ignores it.
Hyperparameters control how your decision tree splits and grows, which affects both complexity and performance. The big ones are max_depth (stops overfitting), min_samples_split (decides when nodes can split), and min_samples_leaf (minimum samples per leaf). Higher max_depth creates detailed trees but you'll risk overfitting. Lower values keep it simple but might underfit. Tuning these honestly feels like guesswork half the time, but there's actual method to it. Grid search works well for the main parameters first. Then just fine-tune based on your validation scores - that's usually my go-to approach.
So classification trees predict categories (spam vs not spam) while regression trees give you actual numbers like house prices. Classification uses Gini impurity to split nodes - it wants the cleanest groups possible. Regression minimizes mean squared error instead. Honestly though? The logic's pretty much the same under the hood. I always forget which metric goes with which lol. Classification spits out probabilities or labels, regression gives you continuous values. Just don't mix up your evaluation metrics or you'll be confused why nothing makes sense.
So the splitting criteria is basically how your tree decides to divide up the data at each step. Gini impurity works great for most stuff - it's fast and gives you solid, balanced trees. Entropy does similar things but takes more computing power, and honestly? The difference is pretty negligible most of the time. Information gain can get weird with features that have tons of categories though. Your choice impacts tree depth and how well it handles new data. I'd just go with Gini unless you have a specific reason not to - why overcomplicate things?
-
The Designed Graphic are very professional and classic.
-
Much better than the original! Thanks for the quick turnaround.