


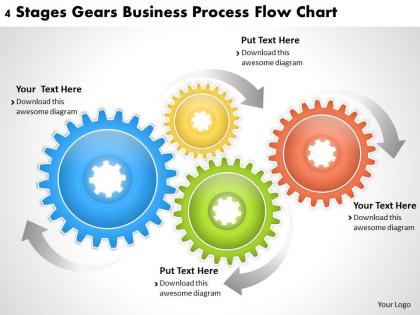
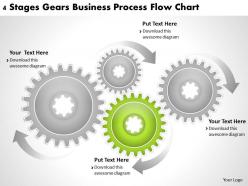
1013 business ppt diagram 4 stages gears business process flow chart powerpoint template




Try Before you Buy Download Free Sample Product
 Impress Your
 Audience
 100%
100% Editable
 Save Hours
 of Time


Our 1013 Business Ppt diagram 4 Stages Gears Business Process Flow Chart Powerpoint Template let you sleep in peace. They make your dreams come true.
People who downloaded this PowerPoint presentation also viewed the following :
1013 business ppt diagram 4 stages gears business process flow chart powerpoint template with all 9 slides:
With thousands of designs to choose from our 1013 Business Ppt diagram 4 Stages Gears Business Process Flow Chart Powerpoint Template library offers near limitless choice. We've got what you need to make your next presentation stellar.

FAQs for 1013 business ppt diagram 4 stages gears business process flow
Okay so you'll want five main things: start/end points, decision diamonds, process rectangles, arrows connecting everything, and swimlanes if different teams are involved. Honestly, the decision diamonds are where most people mess up - that's where your process can go sideways or get bottlenecked. Don't make your arrows create weird loops that confuse everyone. Label each shape with something specific so people aren't constantly bugging you with questions. Oh, and map out what you're actually doing now before trying to fix it. Trust me on that one.
Dude, flow charts are like X-rays for broken processes - they show you exactly where things are screwed up. Map out each step and boom, you'll see all the bottlenecks and redundant crap slowing everything down. People always think they know how their process works, but when you actually draw it out? Totally different story. You'll spot where tasks pile up, approval chains that go on forever, or - my personal favorite - the same info getting entered three times by different people. Once it's all laid out visually, the problems are so obvious you'll wonder how you missed them before.
Honestly, most people stick with Microsoft Visio, Lucidchart, or Draw.io (which they renamed to diagrams.net for some reason). If you're already using Microsoft stuff, Visio works great but costs a fortune. Lucidchart is what I use most - super easy and perfect when you're working with other people on the same diagram. Draw.io is totally free and way more powerful than you'd expect. Works with Google Drive too. Some folks just use PowerPoint or Miro for basic stuff. I'd go with Draw.io if you're broke, Lucidchart if you need something that looks professional for clients.
Honestly, flowcharts are game-changers because everyone stops having different ideas about the same process. You know those meetings where people argue past each other? That stops happening when there's a visual everyone can point to. New people get up to speed way faster too - no more explaining the same workflow twenty times. Bottlenecks become super obvious when you map things out. My team was skeptical at first, but we tried it with our most annoying process and people had those lightbulb moments immediately. Just pick one messy workflow and diagram it out with everyone involved.
Okay so basically symbols are what make flowcharts actually make sense to people. You've got ovals for start/end, rectangles for processes, diamonds for decisions - that kind of thing. Without them you're just drawing random shapes that'll confuse the hell out of everyone. I learned that the hard way on a project last year, total mess. The whole point is having this standardized visual language so your team doesn't have to decode what you meant by that weird hexagon in the corner. Stick with the standard symbols and anyone can jump in and understand your chart immediately.
Honestly, start with whatever processes you do over and over - that's where flowcharts actually pay off. I'd map out workflows before jumping into projects so you can spot bottlenecks early. New team members will thank you too since it cuts down on all those "wait, what comes next?" conversations. During sprint planning, they're great for showing which tasks depend on others. You can also build decision trees for risk management stuff. Most tools like Asana hook up with flowchart apps pretty easily - though I always forget to update mine when processes change, whoops. But seriously, visualizing dependencies saves headaches later.
Don't overthink it - that's mistake
-
Excellent work done on template design and graphics.
-
I discovered this website through a google search, the services matched my needs perfectly and the pricing was very reasonable. I was thrilled with the product and the customer service. I will definitely use their slides again for my presentations and recommend them to other colleagues.