


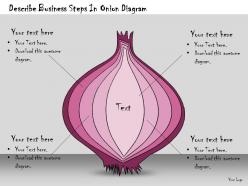
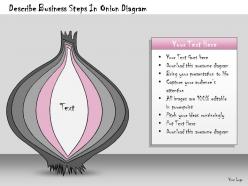
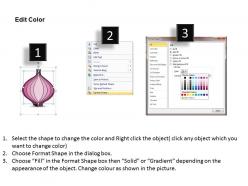
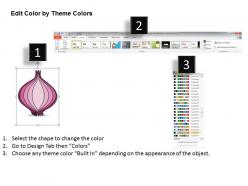
1113 business ppt diagram describe business steps in onion diagram powerpoint template





Try Before you Buy Download Free Sample Product
 Impress Your
 Audience
 100%
100% Editable
 Save Hours
 of Time


It is common to be enthralled by our 1113 Business Ppt Diagram Describe Business Steps In Onion Diagram Powerpoint Template. They have that effect on a lot of people.
People who downloaded this PowerPoint presentation also viewed the following :
1113 business ppt diagram describe business steps in onion diagram powerpoint template with all 10 slides:
Proper digestion is an important element. Offer it on a platter with our 1113 Business Ppt Diagram Describe Business Steps In Onion Diagram Powerpoint Template.
FAQs for 1113 business ppt diagram describe business steps in onion
Key components of a business onion diagram include core values and mission at the center, surrounded by strategic objectives, operational processes, tactical initiatives, and external market factors in outer layers. This layered approach enables organizations to visualize how foundational elements drive decision-making across departments, with many companies finding that this structure enhances strategic alignment and operational clarity.
Onion diagrams effectively visualize complex data by displaying hierarchical relationships through concentric layers, enabling audiences to understand core concepts surrounded by supporting details, dependencies, and contextual information. These visual tools streamline presentations across industries like healthcare, finance, and consulting, where professionals need to communicate multi-layered processes, organizational structures, or strategic frameworks, ultimately delivering clearer comprehension and faster decision-making.
Onion diagrams excel in scenarios requiring hierarchical analysis, such as organizational restructuring, market segmentation strategies, risk assessment frameworks, and product development phases. These visual tools particularly benefit strategic planning initiatives, compliance auditing, and stakeholder mapping projects, with many consulting firms and large enterprises finding that onion diagrams streamline complex decision-making processes while enhancing cross-departmental communication and strategic alignment.
Layering in an onion diagram helps clarify business objectives by organizing them hierarchically from core mission to tactical actions, creating visual clarity and strategic alignment across organizational levels. This structured approach enables leaders to identify dependencies between objectives, prioritize resource allocation more effectively, and ensure operational activities directly support fundamental business goals, ultimately delivering greater strategic focus and measurable outcomes.
Onion diagrams offer enhanced visual hierarchy, simplified relationship mapping, improved audience comprehension, reduced complexity overload, and better focus on core elements compared to traditional charts. These visual advantages enable organizations to communicate strategic priorities, operational dependencies, and organizational structures more effectively, with many businesses finding that stakeholders grasp complex concepts faster, ultimately delivering clearer decision-making and stronger strategic alignment.
Onion diagrams aid strategic planning by visualizing organizational layers from core mission to external stakeholders, enabling leaders to align decisions across all levels systematically. This layered approach helps executives identify strategic priorities, assess resource allocation impacts, and ensure coherent decision-making flows from foundational values outward, with many organizations finding enhanced strategic clarity and improved cross-functional alignment.
**INPUT**: What tools or software are most effective for creating onion diagrams? **OUTPUT**: Effective onion diagram tools include Microsoft Visio, Lucidchart, SmartDraw, Canva, and PowerPoint's SmartArt features, each offering layered visualization capabilities. These platforms streamline diagram creation through drag-and-drop functionality, customizable templates, and collaborative features, with many organizations finding that cloud-based solutions like Lucidchart enhance team coordination while delivering professional presentations. [Word count: 56 words]
Yes, onion diagrams effectively support market analysis by visualizing market segments in concentric layers, from core target customers outward to peripheral markets, competitor positioning, and external factors like regulations and economic conditions. This layered approach enables businesses to prioritize market entry strategies, identify expansion opportunities, and assess competitive landscapes systematically, with many organizations finding that this visual framework streamlines strategic planning and resource allocation decisions.
Common pitfalls include overcrowding layers with excessive information, using inconsistent sizing that confuses hierarchy, poor color choices that reduce readability, and failing to align content with audience needs. These design mistakes undermine clarity and comprehension, with many presenters finding that simplified layering, strategic color coding, and audience-focused messaging deliver significantly more impactful business communications and stakeholder engagement.
Businesses can tailor onion diagrams by customizing visual elements, language, and layer prioritization to match their audience's industry knowledge, cultural preferences, and strategic priorities. Financial services firms might emphasize regulatory compliance layers, while tech companies focus on innovation cycles, with many organizations finding that color-coding, simplified terminology, and audience-specific examples significantly enhance stakeholder engagement and strategic alignment.
Color-coding significantly enhances onion diagram effectiveness by creating visual hierarchy, differentiating organizational layers, improving information retention, and enabling quick pattern recognition across complex business structures. Through strategic color schemes, teams can instantly identify departmental functions, priority levels, and interdependencies, while stakeholders navigate multi-layered processes more efficiently, ultimately delivering clearer communication and faster decision-making in organizational planning.
Onion diagrams integrate seamlessly into business reports by complementing bar charts, flowcharts, and dashboards to show hierarchical relationships, strategic layers, and organizational structures. When combined with performance metrics and trend analyses, these visualizations enhance stakeholder understanding of complex business frameworks, with many executives finding that layered visual storytelling delivers clearer strategic insights and faster decision-making processes.
Companies like Amazon use onion diagrams to visualize their core e-commerce platform surrounded by expanding services like AWS, Prime, and logistics, while Apple structures their ecosystem from hardware core through software layers to services. These strategic frameworks enable organizations to identify growth opportunities, streamline resource allocation, and maintain competitive advantage by clearly mapping how peripheral offerings enhance their central value proposition.
Feedback integration involves systematically reviewing each diagram layer, updating core values and strategic elements based on stakeholder input, and revising supporting processes accordingly. Organizations typically conduct structured feedback sessions with department heads, incorporate suggested refinements into visual hierarchies, and validate changes through pilot implementations, ensuring the refined onion diagram accurately reflects organizational priorities and maintains strategic alignment across all operational levels.
**INPUT**: What research or data sources can inform the layers of an onion diagram for better accuracy? **OUTPUT**: Research sources for onion diagrams include market research, customer surveys, competitive analysis, internal performance data, and stakeholder interviews. These data sources enhance accuracy by providing quantitative insights, customer perspectives, and operational metrics, with many organizations finding that combining external market intelligence with internal analytics delivers more strategic positioning and actionable business outcomes. **Word count: 54 words**
-
Nice and innovative design.
-
It saves your time and decrease your efforts in half.