


 Customer Reviews
85% of businesses believe that using pre-designed PowerPoint Templates makes the presentation drafting process more efficient. 70% of businesses rely on customer feedback to improve their products and services.
These percentages are the result of survey data collected from businesses. If there were no surveys, it would definitely be difficult to obtain such quantitative insights and statistics regarding the beliefs, preferences, practices, etc. of a large number of audiences.
A survey is essential for collecting data directly from a representative sample of your target audience. It allows organizations and researchers to draw meaningful conclusions and make informed inferences about the population.
By downloading our supplier survey templates, you will equip yourself with the tools required to manage supplier relationships and drive continuous improvement in supply chain operations.
Survey Presentation
Designing and administering a survey includes steps like
- Defining the research objectives
- Determining sampling strategies
- Developing the survey questions and formats
- Collecting and analyzing the results
Presenting these findings effectively is vital for communicating the insights derived from the data. A well-drafted survey presentation includes elements like:
- Introduction and background information on the research goals, target population, and methodology of the survey.
- Most significant and relevant findings from the data with the help of charts, graphs, etc
- Detailed analysis of the patterns, trends, and relationships between subgroups within the data.
- Implications and recommendations for effective decision making.
- Limitations or constraints of the study, or any potential areas for future improvement.
The goal is to communicate complicated information in a comprehensive and compelling manner. All this must seem like a lot to take care of while drafting a presentation but worry not. We at SlideTeam have curated these ready-to-use survey presentation templates that will streamline this process. These templates are 100% editable and customizable, with engaging visuals, clear data visualization techniques, and comprehensive explanations.
Let’s explore these top 10 templates now!
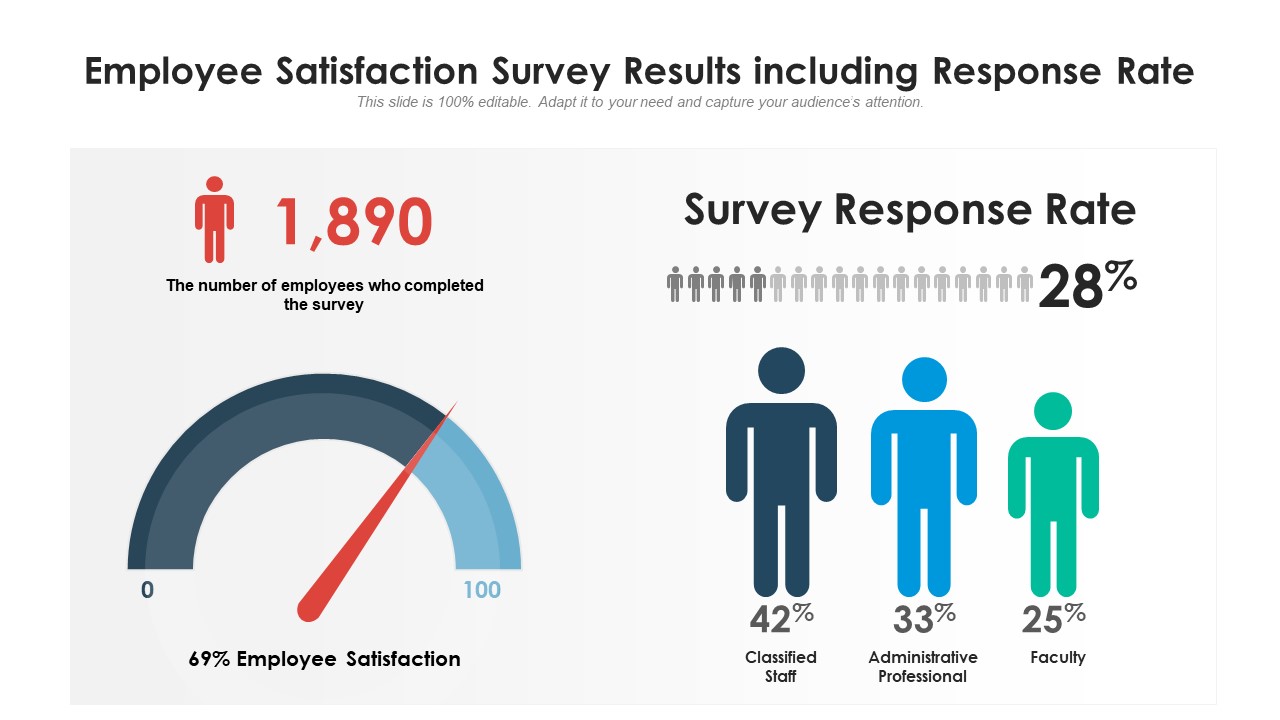
Template 1: Employment Satisfaction Survey Results Including Response Rate
This PowerPoint Slide highlights the overall employee satisfaction survey including the response rate. It includes a meter depicting the employee satisfaction percentage as well as survey response rate which indicates the percentage of employees who responded to the survey. Further, the number of employees who completed the survey is also included in this well-designed template. These elements offer a detailed overview of the reach, validity, and company's response to employee satisfaction based on the feedback received. Grab today!


Template 2: Employment Survey Results
This PowerPoint Slide showcases the results of employment surveys conducted in the organization to gather insights into several aspects of the job experience. It includes six segments with catchy icons that can be employed to depict the specific surveys of the organization. The visual representation of such data allows for easy understanding of the patterns of data and offers comparisons. With the help of these visual elements and summaries, the slide aims to communicate the survey’s outcomes, enabling stakeholders to make viable decisions in relation to employment practices.

Template 3: Survey Result
This PowerPoint Template deck showcases survey data results with the help of charts, graphs and catchy images with summaries explaining the results. It includes multiple attributes that help in a quick understanding of the findings from the survey. This PPT Bundle in 17 slides highlights employee engagement survey results of 30 countries, survey results of company conduct employee engagement, survey results of customer satisfaction, survey results if export cars, and more.

Template 4: Employee Survey Result
This PowerPoint Template deck offers a visual representation of employee survey data through charts, graphs, and engaging visuals depicting elements such as work-life balance, job satisfaction, and more. These highlights aid in focusing on strengths, and areas of improvement for the employee which results in enhanced employee experience. This PowerPoint Template bundle in 19 slides highlights monthly survey result analysis of employees, employee satisfaction based survey result analysis, survey result analysis dashboard, employee engagement questionnaire, etc. Download this informational PPT Template bundle now!

Template 5: Survey Satisfaction Survey Results for Product
This PowerPoint Slide showcases the survey satisfaction results for a product through visually appealing graphs and pie charts. It includes key components such as the overall satisfaction rate in percentage, satisfaction with the product offered, and overall satisfaction from support services. In addition, the template also features pie charts to show customers receiving higher satisfaction and higher value for money. The overview that this template offers on customer behavior enables companies to improve their products and achieve higher customer satisfaction

.
Template 6: Market Survey Analysis
This PowerPoint Template deck highlights market survey data with eye-catching visuals such as graphs, charts, and more that offer insights about the size of the market, growth potential, customer preferences, and more. This PPT Deck includes 19 slides on market research and survey analysis dashboard, market survey analysis performance report, analysis of different brands, and more. Get this informational bundle now!

Template 7: Employee Engagement Survey Action Plan
This PowerPoint Template offers steps to be taken based on the employee engagement survey findings. It highlights 18 slides on effective employee engagement action plan post survey, engagement survey action plan to increase employee productivity, action plan to improve employee engagement post survey, post conducting survey, and more. It essentially focuses on areas for improvement, assigning responsibilities, establishing timelines, and more to enhance overall workplace engagement and satisfaction.

Template 8: Engagement Survey
This PowerPoint Template deck aims to establish context for the presentation by highlighting the need to understand the importance of employee engagement within the organization. Employee engagement is the direct result of the workforce’s dedication, motivation, and alignment with the goals of the company. This template bundle in 17 slides illustrates a checklist for attaining effective engagement survey results, a dashboard highlighting stakeholders engagement survey results, employee feedback survey results to assess team engagement, etc. The purpose of this survey is to collect valuable insights from the employees and locate the areas of improvement.

Template 9: Survey Results Dashboard
This PowerPoint Slide deck presents a dashboard through which companies can visually present detailed survey results with the help of charts, images, graphs, and metrics. The following deck in 17 slides showcases the survey results dashboard pn coronavirus recovery rates, a dashboard for product campaign survey results, the company’s net promoter score, and more. The survey finding enables organizations to explore the data after survey findings and promote data-driven decisions accordingly. Get this information PPT Template deck today!

Template 10: Survey Design
Are you looking for the perfect survey design for your upcoming research? This Survey design PPT Bundle in 17 visually appealing slides is professionally designed for various organizations or requirements. It includes slides on employee job satisfaction survey design, help desk feedback survey design, workplace happiness survey results design, etc. These can effectively be employed for statistical results and data-driven decisions. Download this template design now!

ASK, ANALYZE, ACHIEVE
Surveys have proven vital for companies and researchers across multiple domains. They help gather diverse perspectives, uncover trends, and eventually make informed decisions. Based on the survey results, the company can make effective changes in its functioning and processes to gain more profits and success. They are the bridge between perception and reality, allowing deeper understanding of the world around us and unlocking new opportunities.
PS: Also check out our survey data analysis templates that help businesses to target specific problems related to analyzing survey data and take proactive steps to manage them.


