In a business, the first major breakthrough is breaking-even. This means that you will make enough money to cover the capital you have invested. This, however, is not a matter of chance. Every business needs to plan its finances to reach the break-even point as it will ultimately lead to profits. Break-even analysis is used to conduct this planning.
If you're looking to do this analysis, this guide is for you. We'll cover everything you need to know, including what break-even analysis is, how it's used, and what factors are to be considered when conducting your own analysis. In addition, we've included a few break-even analysis templates to help you get started. Let’s begin by learning more about this tool.
What is Break-Even Analysis?
Break-even analysis is a tool used to calculate the point at which a company's revenues equal its expenses. This point is known as the Break-Even Point (BEP). It is used to assess whether a business is likely to be profitable.
There are two main types of break-even analysis: Graphical and chart.
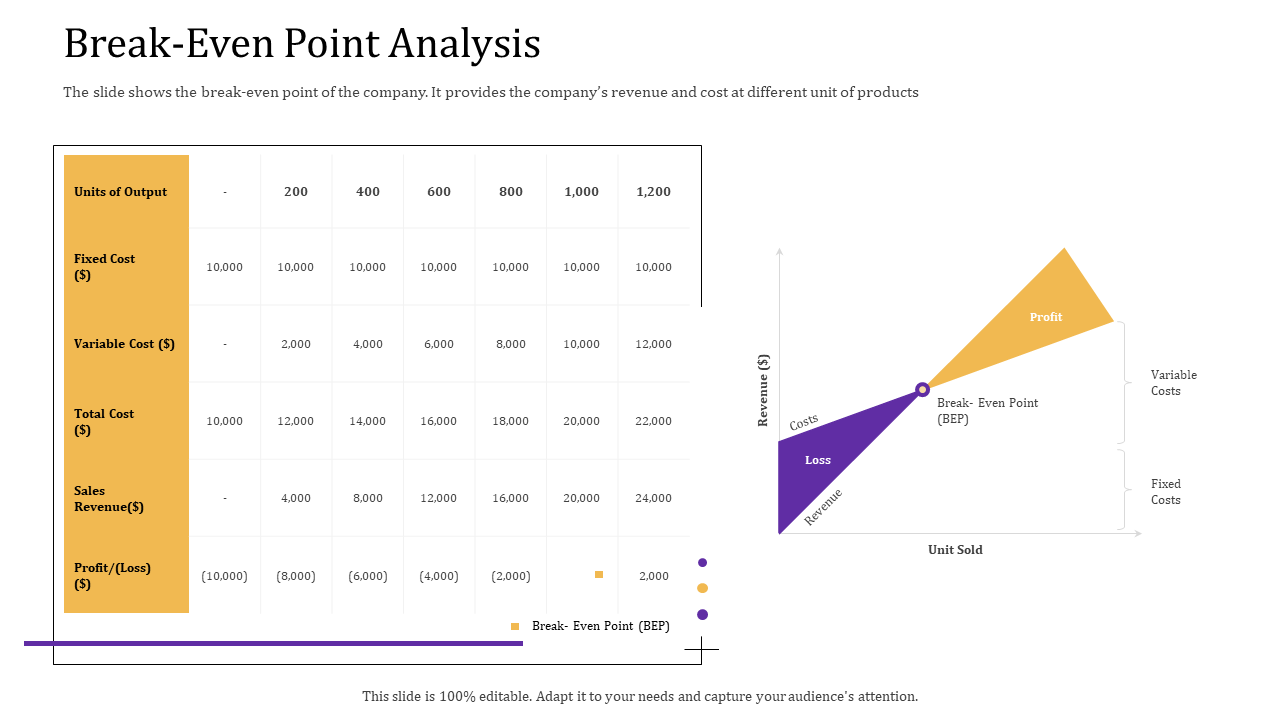
Graphical break-even analysis is a visual way to calculate the break-even point. This method uses a graph, which plots total revenue and total cost. The BEP is the point at which total revenue and total cost intersect.
The break-even chart, however, is a table that shows the break-even point in terms of units sold and currency. This method is more precise than graphical break-even analysis, but it can be more difficult to understand.
Taking note of the graphical method, let us understand the steps you need to take to conduct your own break-even analysis through PowerPoint.
How to Conduct Break-Even Analysis?
There are a number of factors you should consider when conducting a break-even analysis. These are:
- Sale price: The price at which a product or service is sold.
- Unit cost: The cost of producing one unit of a product or service.
- Fixed costs: The costs that remain constant regardless of the level of activity or sales. Examples include rent, insurance, and salaries.
- Variable costs: The costs that vary in relation to the level of activity or sales. Examples include raw materials and commission.
- Break-even point: The point at which revenue equals costs.
With these parameters in mind, let us look at the steps that will help you conduct a graphical analysis.
Step 1: Insert Line Chart into the Slide
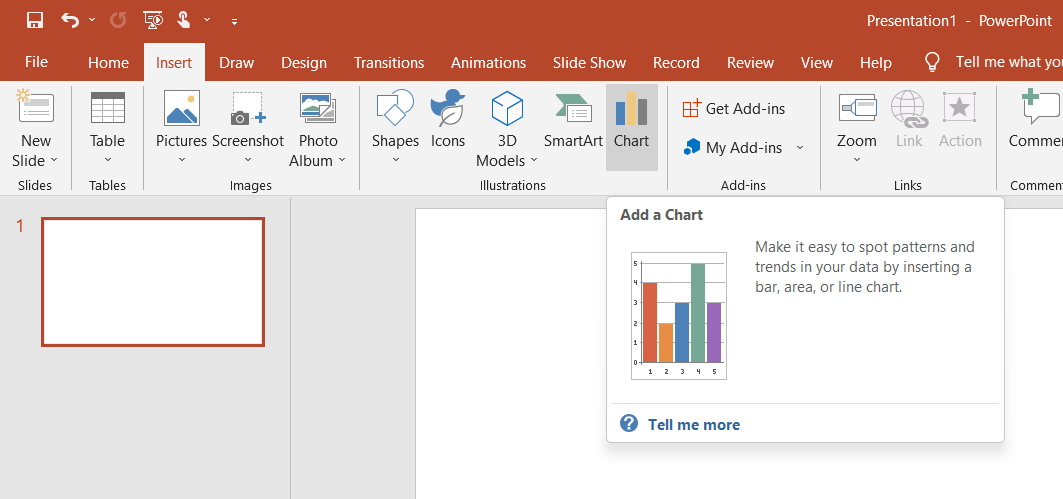
The graph will be made of a line chart. You can select it using
Insert > Chart > Line Chart > OK.
You will find an Excel sheet dialog box that has appeared on top of the graph.
Step 2: Add the Values of the Variables in the Excel Sheet
Add the values of the fixed cost, variable cost, and revenue into the Excel sheet.
Step 3: Check the Results and Customize the Graph
You will see that the intersection of total cost and revenue is the break-even point. The final result should look like this:
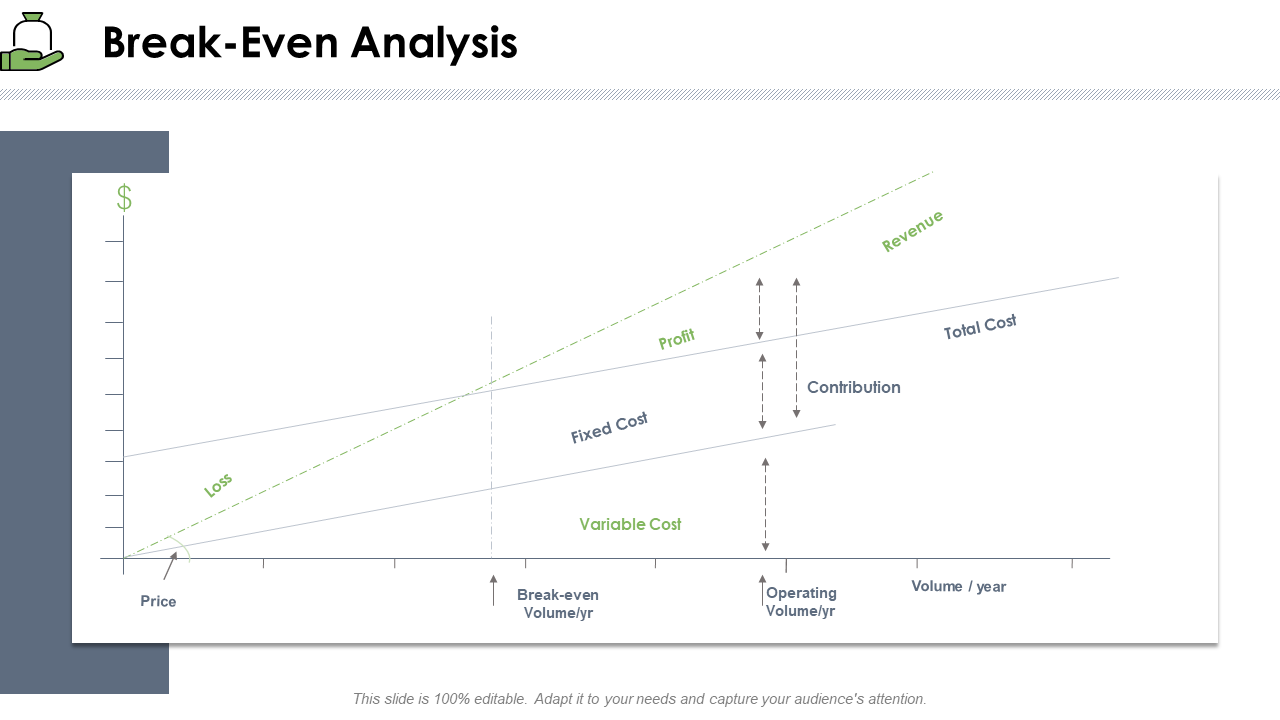
To go even deeper into the process, we present a full-fledged break-even analysis graph with notations:
With these easy steps and a simple line chart, you can create a graph based on your own data. In this format, the data is quite useful.
Applications of Break-Even Analysis
There are numerous applications of break-even analysis. This is done by estimating the fixed and variable costs associated with the business and then calculating the break-even point. Some common applications include:
- Determining the desired sales volume needed to break even
- Determining the price of a product or service
- Predicting the financial impact of changes in variable costs, fixed costs, and selling price
- Assessing the financial viability of a business idea
- Understanding how changes in costs or prices will impact profitability
Break-even analysis can ensure that the company’s profitability heads North.
Advantages of Break-Even Analysis
There are several advantages of break-even analysis:
First, it can help owners and managers understand the relationship between revenue and costs. This information can be used to make decisions about pricing, production levels, and other factors that affect the bottom line.
Second, break-even analysis can help owners and managers predict how changes in costs will affect the break-even point. This information can be used to make decisions about how to respond to changes in the business environment.
Third, break-even analysis can help owners and managers compare the financial performance of different businesses. This insight can be used to make decisions about which business to invest in or expand.
Finally, break-even analysis can help owners and managers monitor the financial performance of their business over time.
Despite its many advantages, break-even analysis is not without its cons.
Disadvantages of Break-Even Analysis
One of the main disadvantages of break-even analysis is that it can be quite difficult to estimate all costs. Hence, the break-even point could be overestimated or underestimated, leading to losses or missed opportunities.
Another downside of break-even analysis is that it only looks at the financials of a product or project. Factors like customer demand or satisfaction are not accounted for. This can create a false sense of security among decision-makers who may think that a product is more successful than it actually is.
Finally, break-even analysis can be quite simplistic and does not always provide the most accurate picture of a business's financial health. This tool is only one part of the decision-making process and can never be used as the sole criteria to value a business.
With such complete knowledge of break-even analysis, let us learn how to best communicate the analysis and its results across the rank and file of your business.
Editable Break-Even Analysis Templates to Make Better Financial Decisions
Without the worry of choosing the design, font, or size, selecting one of our pre-designed break-even analysis templates can be the best gift for this analysis. Raw data from such a financial study can be difficult to understand, so it is essential that we use either a graph or a chart to present it.
Let’s take a look at the ten break-even analysis templates we have curated.
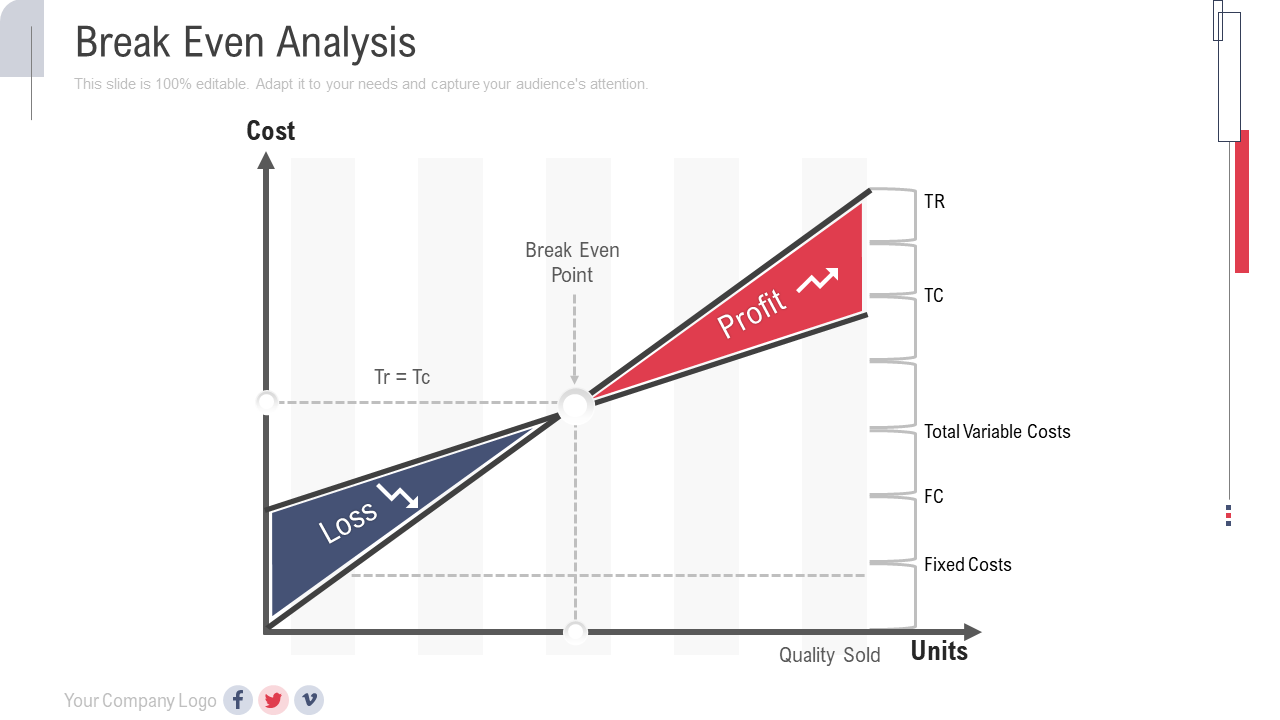
Template 1: Break-Even Analysis PowerPoint Presentation
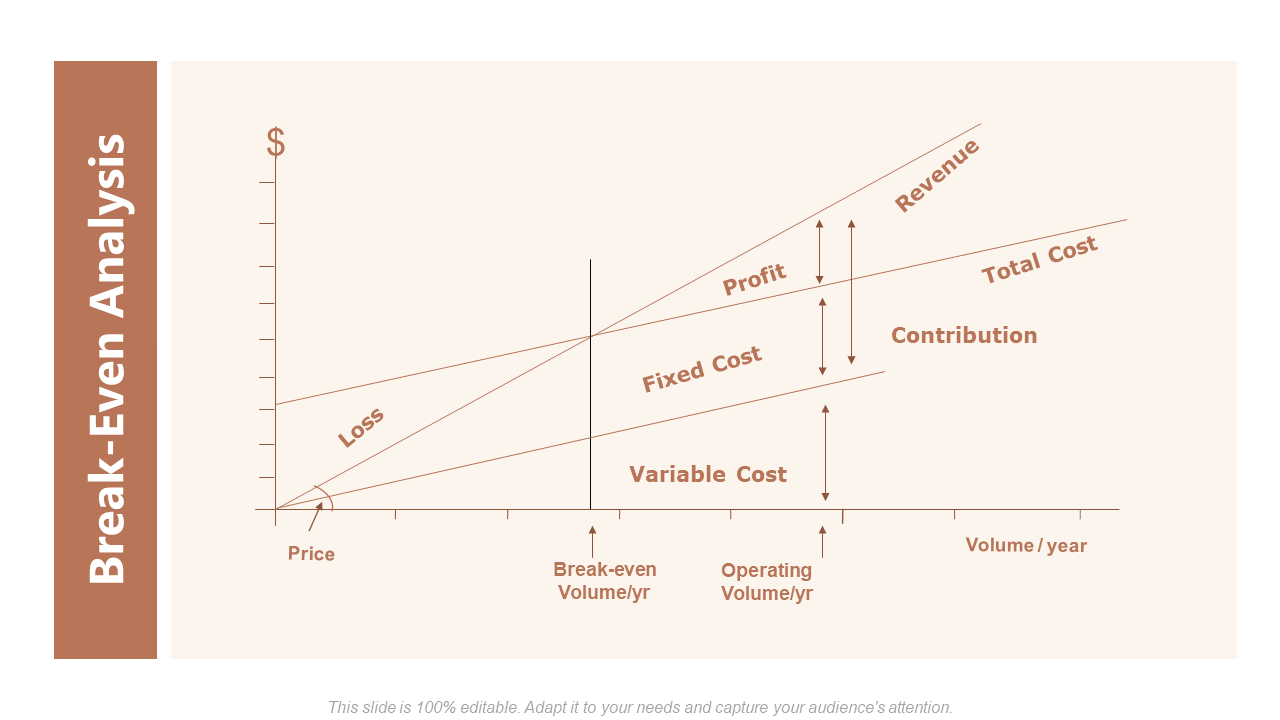
This PPT layout showcases a graph to represent the terms necessary to understand break-even analysis. It presents costs, revenue, profit and loss, contribution, etc. Use this PowerPoint slide to present and explain your company’s financial data and its significance. Download it now.
Template 2: Break-Even Analysis Startup Company Strategy PPT
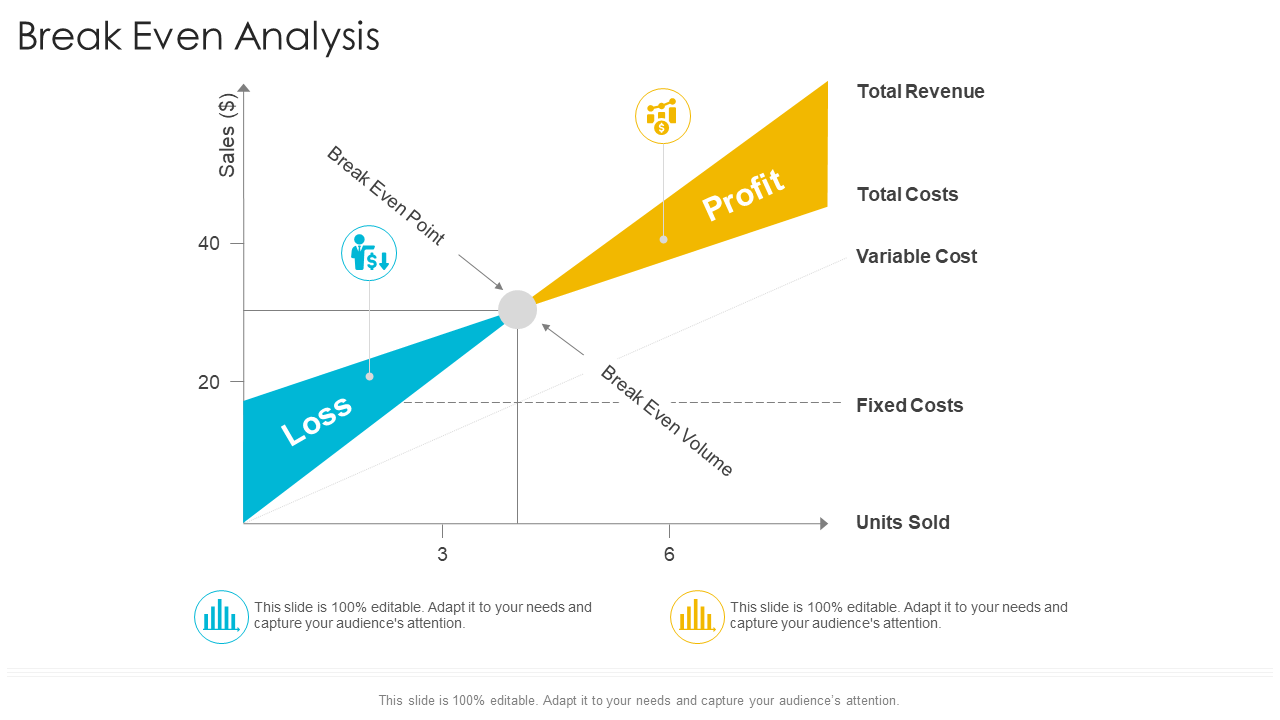
This PowerPoint theme focuses on the profit and loss areas that surround the BEP. It allows your company to focus on the sales volume needed to not only break even but start earning profits. Incorporate it now.
Template 3: Break-Even Analysis New Service Initiation Plan PPT
This PPT preset presents your sales data in a way to inspire the employees to meet your goals. The color scheme allows the company to visualize its short and long terms goals, in terms of profitability. Use it right away!
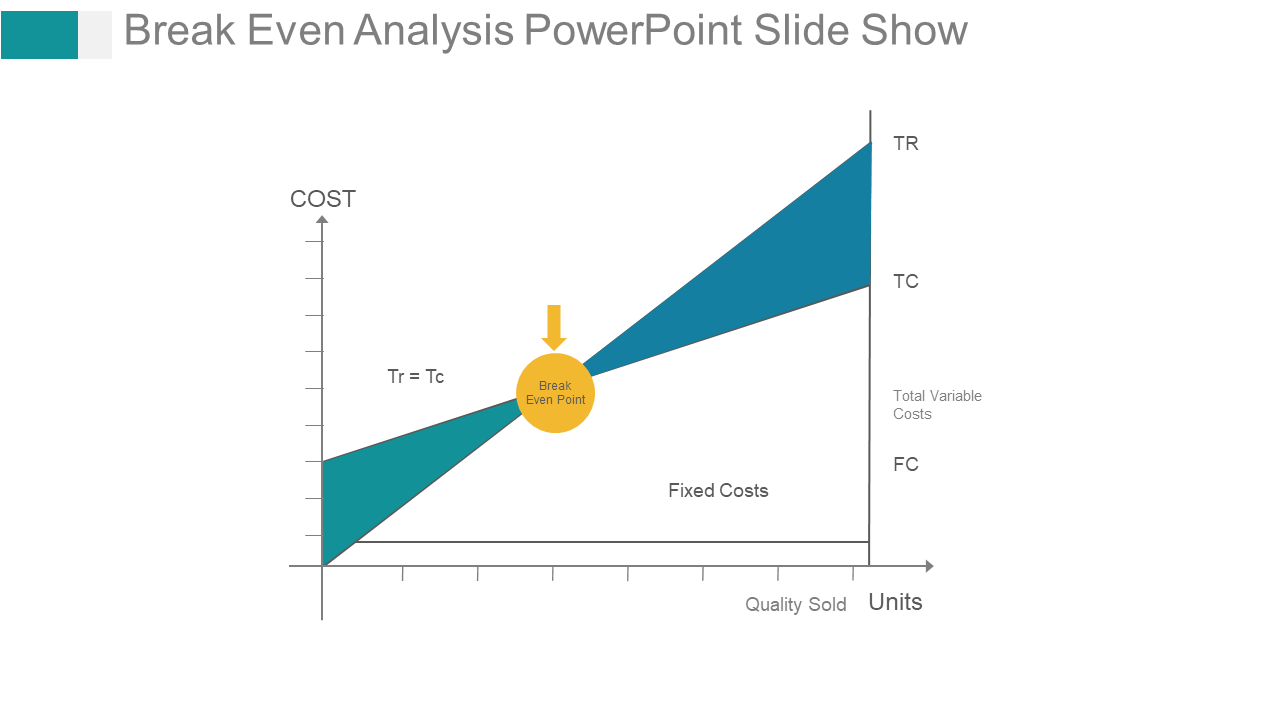
Template 4: Break-Even Analysis PowerPoint Slide
This PowerPoint slide presents a ballpark view of the sales goal of the company. It provides an emphasis on the BEP, hence, it is suitable for a start-up. The Tr and Tc represent the total revenue and total cost. Assimilate it now.
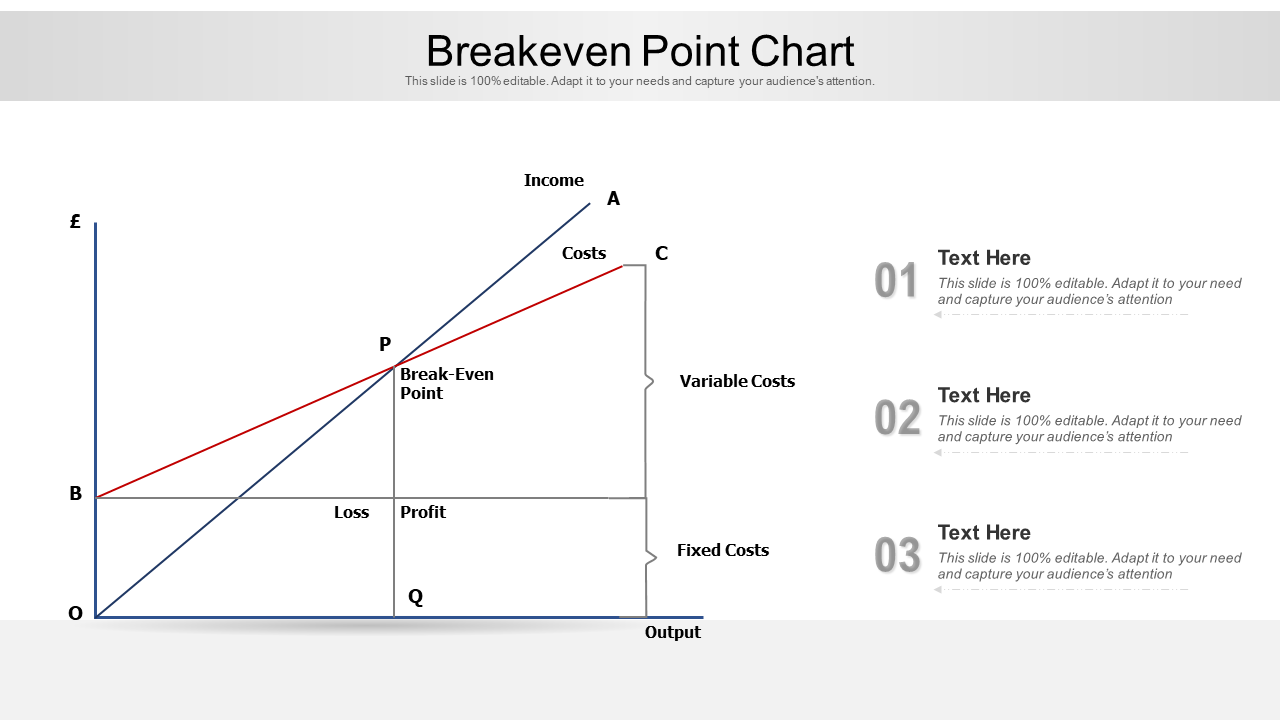
Template 5: Break-Even Point Chart
With the help of this PPT set, you can graphically present the logistics of your operations. It also allows extra space to note down any significant conclusions made from the graph. Incorporate it now.
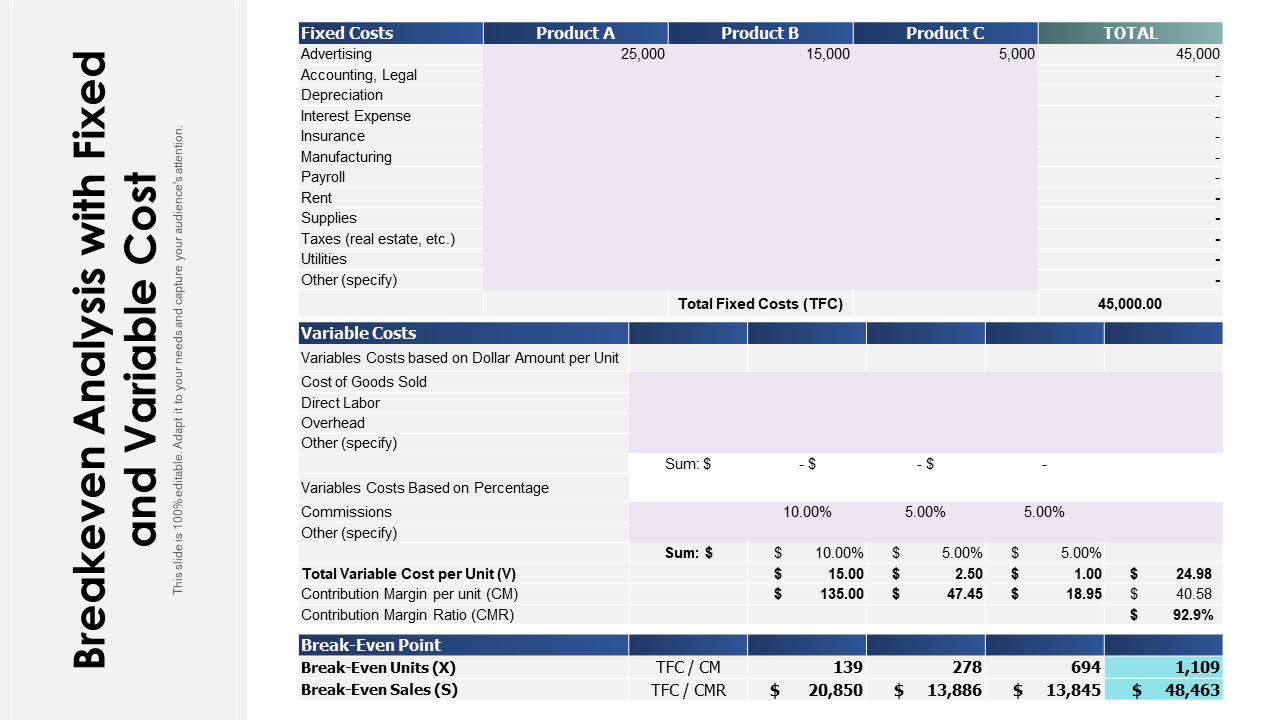
Template 6: Break-Even Analysis With Fixed and Variable Cost
This PowerPoint bundle presents the second form of the break-even analysis, the chart. It allows for a more detailed understanding of the cost and revenue of the operations by splitting up the variables into individual categories. This includes advertising, rent, payroll, etc. Download it now.
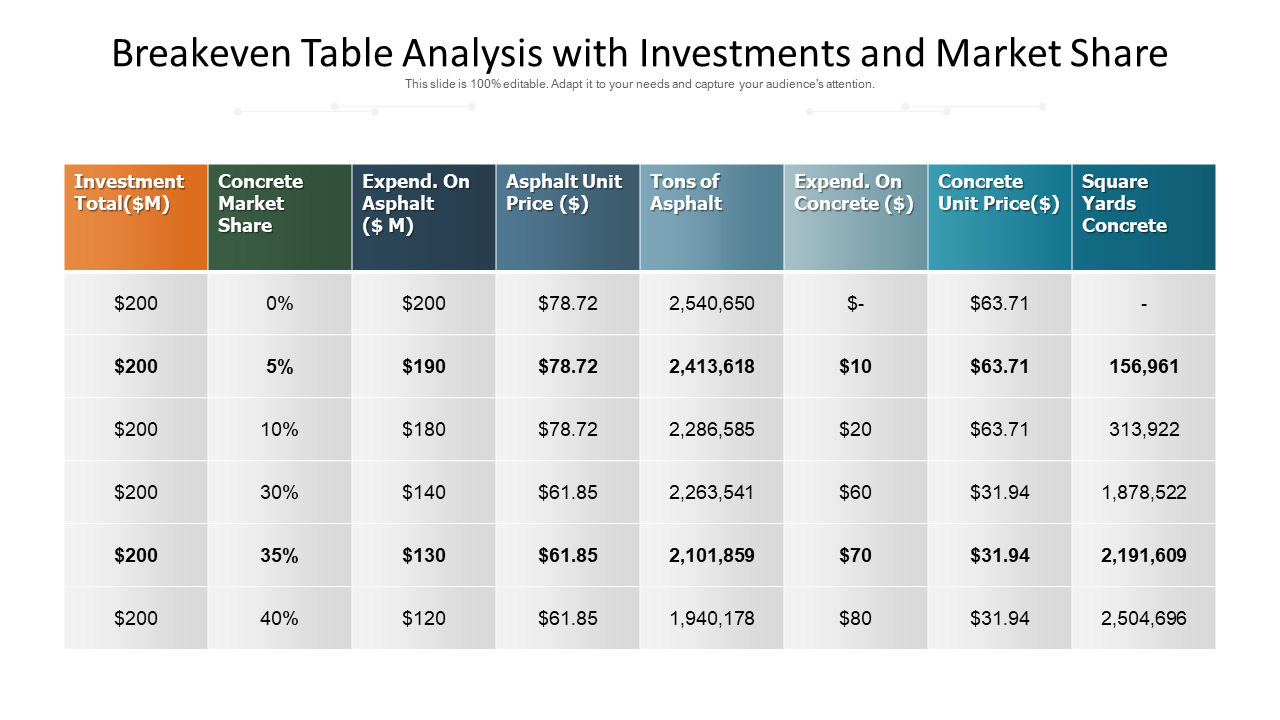
Template 7: Break-Even Table Analysis With Investments and Market Share
This PPT layout presents a tabular analysis. The table showcases variables such as investment total, concrete market share, expense, and market share. The columns are color-coded and the significant values are given in BOLD to allow better comprehension of data. Get it now.
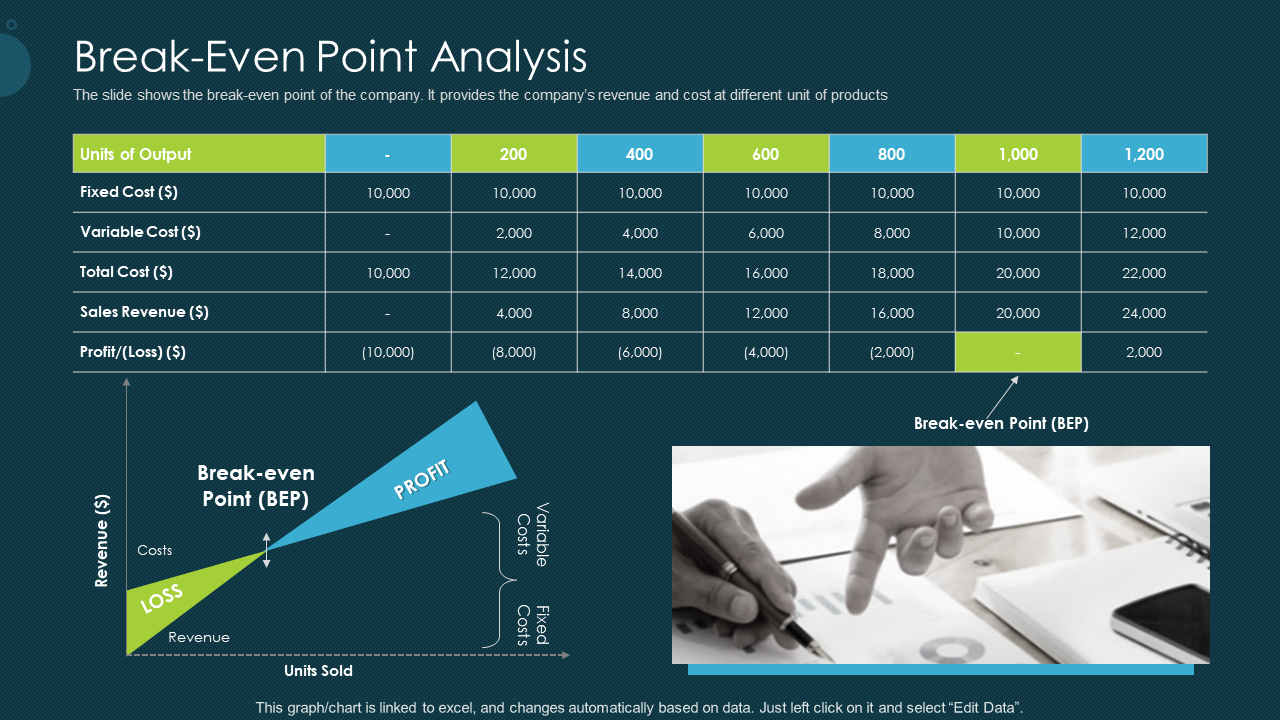
Template 8: Break-Even Point Analysis Loan Stock Financing PPT
Utilize this PowerPoint bundle to help finance your firm. With both the chart as well as the graph, you will be able to make a detailed yet easy-to-understand pitch to your investors. Incorporate it now.
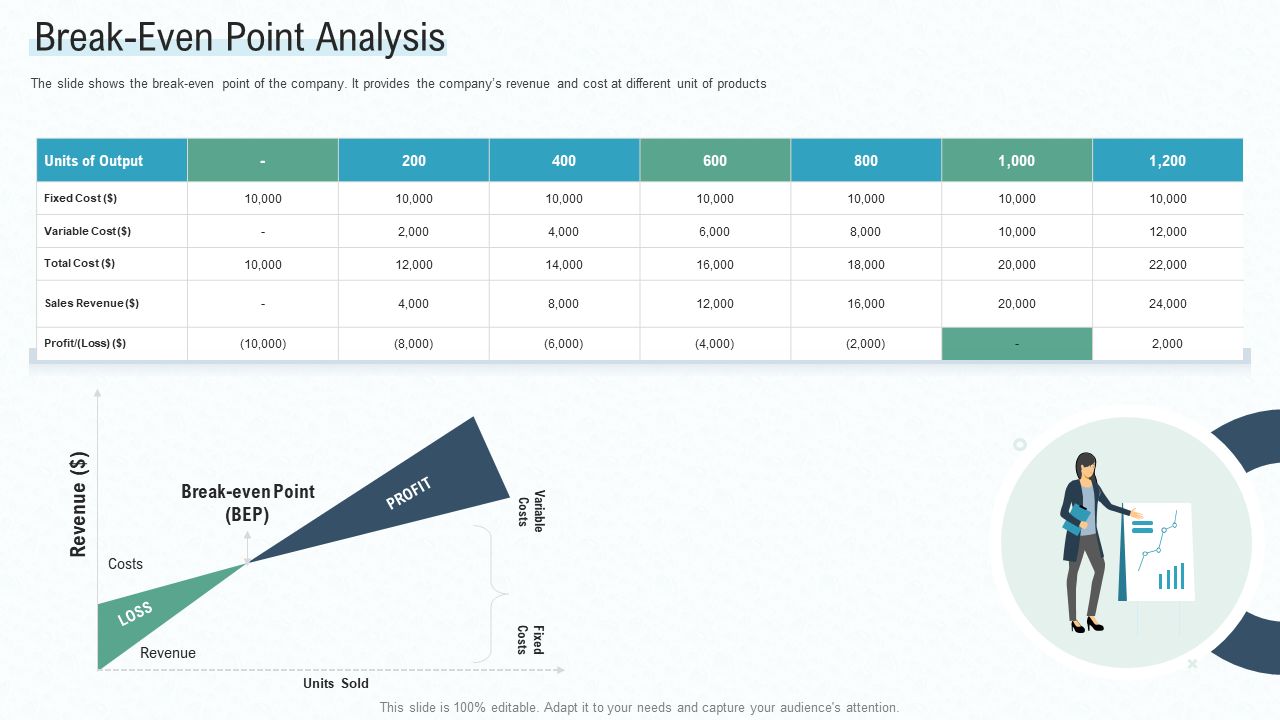
Template 9: Funding Pre-Seed Capital Break-Even Point Analysis PPT
Use this PPT theme to attract capital for your start-up. It allows angel investors to understand the cost details and sales goals of your firm. Download it now and present a clear view of the horizons of your business.
Template 10: Break-Even Point Analysis Early Stage Funding PPT
With the help of this PowerPoint deck, you can pitch your corporation’s financial plans to gain early-stage investment. Utilize this slide to break down the costs and expected sales forecast for your operation. Leave nothing to chance and get this PPT template now.
Conclusion
Use our break-even analysis templates to conduct your own analysis. Simply input your sales price, unit cost, and fixed costs, and the break-even point calculator will do the rest!
P.S: Handling the finances of the business means maintaining a proper budget. Check out this guide to help your company’s employees keep finances in order. All the best templates are included!
Download the free Break-Even Analysis Templates PDF.


![The Superfast Guide to Break-Even Analysis [PPT Templates Included] [Free PDF Attached]](https://www.slideteam.net/wp/wp-content/uploads/2022/06/1013x441no-button-1.gif)


 Customer Reviews

