

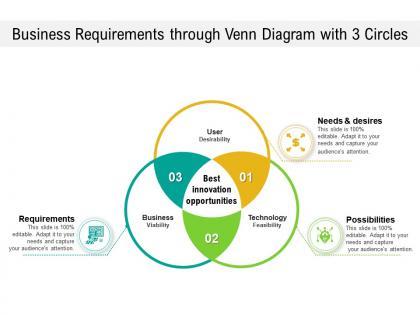
Business requirements through venn diagram with 3 circles




Try Before you Buy Download Free Sample Product
 Impress Your
 Audience
 100%
100% Editable
 Save Hours
 of Time


Our Business Requirements Through Venn Diagram With 3 Circles are topically designed to provide an attractive backdrop to any subject. Use them to look like a presentation pro.
People who downloaded this PowerPoint presentation also viewed the following :
Business requirements through venn diagram with 3 circles with all 2 slides:
Use our Business Requirements Through Venn Diagram With 3 Circles to effectively help you save your valuable time. They are readymade to fit into any presentation structure.
FAQs for Business requirements through venn diagram
A Venn Diagram in business requirements visually represents overlapping relationships between different stakeholder needs, system functionalities, and project constraints, enabling teams to identify intersections, gaps, and conflicts. This visualization streamlines requirement analysis by highlighting shared priorities, potential redundancies, and integration points, ultimately delivering clearer project scope and enhanced stakeholder alignment.
Venn diagrams help identify overlapping stakeholder requirements by visually mapping different groups' needs, priorities, and expectations in intersecting circles. This approach enables project managers to discover shared objectives, resolve conflicting demands, and prioritize features that satisfy multiple stakeholders simultaneously, ultimately streamlining decision-making and enhancing project alignment across diverse organizational interests.
Key components include stakeholder needs, technical constraints, budget limitations, timeline requirements, and regulatory compliance factors. These elements work together by identifying overlapping areas where business objectives, technical feasibility, and resource availability intersect, with many organizations finding that visual requirement mapping streamlines project planning and enhances stakeholder alignment.
A Venn Diagram facilitates cross-functional communication by visually mapping shared requirements, overlapping responsibilities, and distinct team priorities in one accessible format. This visual approach eliminates misunderstandings between departments like IT, marketing, and operations, enabling teams to identify collaboration opportunities, resolve conflicting objectives, and align on shared deliverables, ultimately streamlining project coordination.
Venn Diagrams enable organizations to visualize shared requirements across departments by mapping common needs, resources, technologies, and processes in overlapping sections. Through systematic comparison, business units like marketing, sales, and operations can identify redundant software licenses, shared compliance needs, and collaborative project opportunities, ultimately streamlining resource allocation and enhancing cross-functional efficiency.
Common misconceptions include believing Venn diagrams oversimplify complex business relationships, only work for two-way comparisons, or lack strategic value in professional settings. However, these visual tools effectively map stakeholder requirements, identify process overlaps, and clarify project dependencies across departments, with many organizations finding that well-constructed diagrams streamline decision-making and enhance cross-functional collaboration significantly.
Effectively prioritizing requirements in a Venn Diagram involves analyzing overlapping areas first, as these represent shared stakeholder needs with highest implementation value, followed by unique requirements based on business impact and feasibility. Organizations streamline decision-making by focusing resources on intersection points that deliver maximum stakeholder satisfaction, while balancing individual requirements against strategic objectives, ultimately ensuring optimal resource allocation and project success.
Professional Venn diagram creation tools include Microsoft Visio, Lucidchart, SmartDraw, Canva, and PowerPoint's SmartArt features. These platforms streamline diagram development by offering customizable templates, collaborative editing capabilities, and seamless integration with business systems, with many organizations finding that cloud-based solutions like Lucidchart enhance team productivity while delivering professional visualizations for strategic presentations.
Healthcare, financial services, retail, manufacturing, and technology sectors benefit significantly from Venn Diagrams for business requirements analysis. These industries use this visual tool to identify overlapping stakeholder needs, regulatory compliance requirements, and operational constraints, ultimately streamlining project planning and ensuring comprehensive requirement coverage across complex organizational structures.
Before drawing a Venn Diagram for business requirements, conduct stakeholder interviews, gather comprehensive project documentation, define clear scope boundaries, and identify all overlapping elements across departments or systems. Through systematic requirement analysis, organizations streamline project planning by visualizing intersections between user needs, technical constraints, and business objectives, ultimately delivering clearer communication and reducing scope creep throughout implementation.
Venn diagrams enhance agile project management by visualizing overlapping requirements, identifying shared dependencies between sprints, and clarifying stakeholder alignment across user stories. These visual tools streamline sprint planning sessions, facilitate cross-functional team collaboration, and minimize requirement conflicts, with many agile teams finding that diagram-based requirement mapping accelerates delivery cycles and improves stakeholder communication.
Techniques to enhance business Venn Diagrams include using distinct color coding, clear labeling with concise terminology, strategic sizing to reflect data proportions, and incorporating quantitative data within each section. These visual optimization methods streamline stakeholder communication by minimizing ambiguity, accelerating decision-making processes, and ensuring complex business relationships are easily understood, with many organizations finding that well-designed diagrams significantly improve project alignment and strategic planning outcomes.
Stakeholder feedback can be incorporated through structured review sessions, collaborative workshops, and iterative refinement cycles that validate overlapping requirements and identify gaps. By engaging cross-functional teams including product managers, developers, and end-users in regular diagram reviews, organizations streamline requirement alignment, enhance stakeholder buy-in, and ultimately deliver solutions that address real business needs more effectively.
Challenges in developing Venn Diagrams include data complexity, overlapping boundary definitions, stakeholder alignment issues, and visual clarity constraints when representing multiple intersections. These obstacles can be mitigated through iterative stakeholder workshops, standardized terminology frameworks, and phased diagram development, with many organizations finding that collaborative validation sessions ultimately streamline requirements gathering and enhance cross-functional understanding.
Venn Diagrams integrate seamlessly with stakeholder analysis, process mapping, SWOT analysis, and user story development to create comprehensive requirement frameworks that reveal overlapping needs and dependencies. This strategic combination enables business analysts to identify conflicting requirements, prioritize shared objectives, and streamline communication across departments, with many organizations finding that visual requirement mapping accelerates project alignment and reduces costly misunderstandings.
No Reviews