Corporate Performance Management Powerpoint Presentation Slides
Create a stunning presentation by employing Corporate Performance Management PowerPoint Presentation Slides. This operational intelligence PowerPoint template helps you display valuable business insights. This competitive intelligence PPT template deck showcases the key areas such as architectural framework, data design, and data integration design. Take the advantage of industrial AI PPT slideshow to demonstrate sophisticated subjects like information architecture, and dimensional modeling. Our business intelligence PowerPoint presentation is replete with the latest business intelligence statistics, tools, and trends. Illustrate other important information like industries that use BI and key drivers with the help of our artificial intelligence PPT deck. This commercial intelligence presentation helps to showcase how BI assists in developing business. This integrated business planning PowerPoint theme also sheds light on advanced analytics techniques and methods. Utilize our content-ready business intelligence PowerPoint template to convey your BI design and implementation in a compact manner. Download the corporate intelligence PowerPoint slideshow to represent your plan to expand business horizons.
Create a stunning presentation by employing Corporate Performance Management PowerPoint Presentation Slides. This operation..
- Google Slides is a new FREE Presentation software from Google.
- All our content is 100% compatible with Google Slides.
- Just download our designs, and upload them to Google Slides and they will work automatically.
- Amaze your audience with SlideTeam and Google Slides.
-
Want Changes to This PPT Slide? Check out our Presentation Design Services
- WideScreen Aspect ratio is becoming a very popular format. When you download this product, the downloaded ZIP will contain this product in both standard and widescreen format.
-

- Some older products that we have may only be in standard format, but they can easily be converted to widescreen.
- To do this, please open the SlideTeam product in Powerpoint, and go to
- Design ( On the top bar) -> Page Setup -> and select "On-screen Show (16:9)” in the drop down for "Slides Sized for".
- The slide or theme will change to widescreen, and all graphics will adjust automatically. You can similarly convert our content to any other desired screen aspect ratio.
Compatible With Google Slides

Get This In WideScreen
You must be logged in to download this presentation.
PowerPoint presentation slides
Presenting Corporate Performance Management Powerpoint Presentation Slides. The PPT can be easily edited in MS PowerPoint and is compatible with Google Slides. Add your company name, symbol, or logo within seconds. The slide also supports both the standard screen(4:3) and widescreen(16:9) aspect ratios. High-quality graphics ensure that pixelation or distortion doesn’t occur.
People who downloaded this PowerPoint presentation also viewed the following :
Content of this Powerpoint Presentation
Slide 1: This slide introduces Corporate Performance Management. State your Company name and begin.
Slide 2: This slide displays Content.
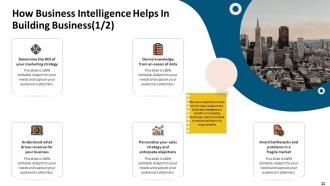
Slide 3: This slide explains How Business Intelligence Helps In Building Business
Slide 4: This slide covers statistics about the BI application usage by the companies for data management. User can enter values according to his requirements
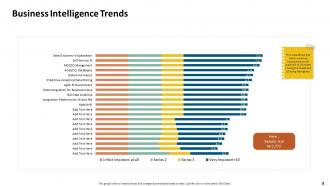
Slide 5: This slide shows that which trend has importance on the scale of 1 to 10 where, 1 being the lowest and 10 being the highest.
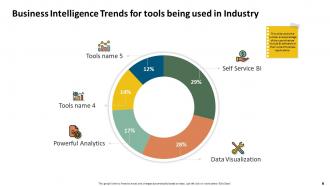
Slide 6: This slide covers the number and percentage of the users that are include BI software’s in their suite of business applications.
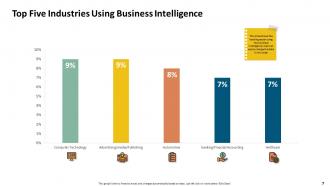
Slide 7: This slide shows the leading sector using the business intelligence. User can easily change the data in this slide
Slide 8: This slide shows Key Drivers.
Slide 9: This slide shows the market size for 10 years & top vendors in Business Intelligence market. It’s a data driven slide which can easily be changed by the customer
Slide 10: This slide covers the evolution of Business Intelligence Industry from one phase to another.
Slide 11: In this slide, We have listed down some of the major areas where Business Intelligence is helpful in increasing revenues. User can choose or add according to his requirements
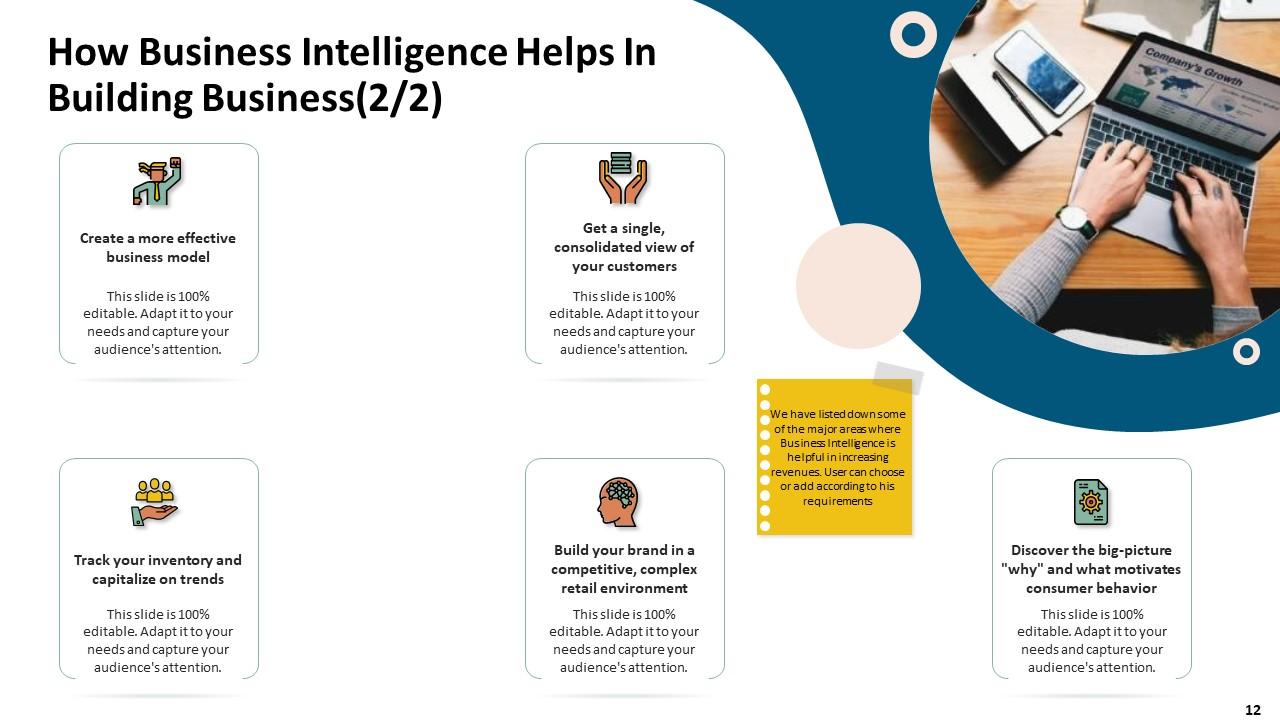
Slide 12: This slide shows some of the major areas where Business Intelligence is helpful in increasing revenues. User can choose or add according to his requirements
Slide 13: This slide shows Architecture Introduction
Slide 14: This slide displays Architecture Introduction.
Slide 15: This slide depicts a framework with the Technologies and components of an information architecture system. User can alter according to his requirements
Slide 16: This slide covers that how data is governed i.e. how data is collected, and how it is stored, arranged, integrated, and put to use in data systems and in organizations. User can edit according to his requirements
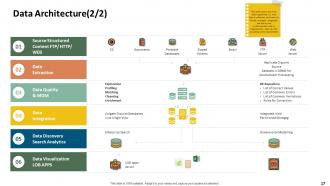
Slide 17: This slide covers that how data is governed i.e. how data is collected, and how it is stored, arranged, integrated, and put to use in data systems and in organizations. User can edit according to his requirements
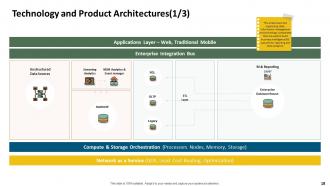
Slide 18: This slide covers the organizing data, information management and technology components that are used to build business intelligence (BI) systems for reporting and data analytics.
Slide 19: This slide shows that how data is taken from the sources to warehouse and then performing BI analytics on the data so that it can be used by customer.
Slide 20: This slide shows that the data is extracted from the source systems with ETL layer and transfer into data bases system and on that stored data several BI analytics tools are performed so that we can get presentable data.
Slide 21: This slide shows Foundational Data Modelling
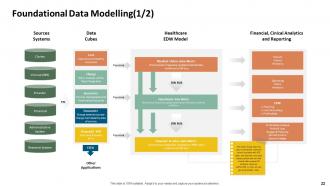
Slide 22: This slide explains Foundational Data Modelling
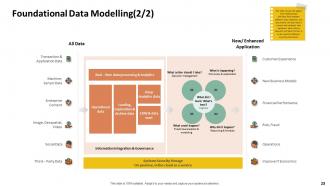
Slide 23: This slide shows the logical inter-relationships and data flow between different data elements and documents the way data is stored and retrieved also represent what data is required and what format is to be used for different business processes.
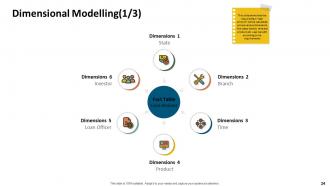
Slide 24: This slide shows that the required fact “loan amount’ can be calculated across various dimensions like state, branch, time and product etc. user can edit according to his requirements
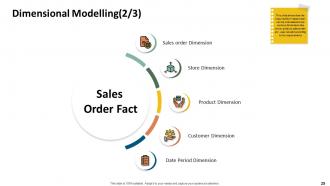
Slide 25: This slide shows that the required fact “sales order’ can be calculated across various dimensions like store, product, sales order etc. user can edit according to his requirements
Slide 26: This slide shows the dimensional modelling of the tables where PK is primary key of the specific table and FK is the foreign key in fact table. User can edit according to his requirements
Slide 27: This slide shows Data Integration Design
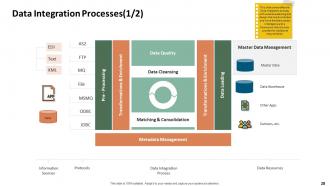
Slide 28: This slide covers effective Data Integration process, with extensive planning and design that results in better and more flexible business intelligence and a framework that is future-proofed for additional requirements.
Slide 29: This slide shows that how various activities are performed on data and the transformed into integrated data. User can edit according to his requirements
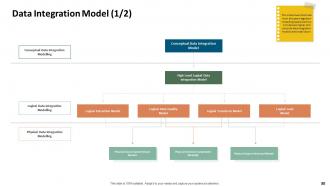
Slide 30: This slide shows Data Integration Model.
Slide 31: This slide shows that data quality & data integration model contain the ability to produce a clean file, reject file, and reject report that would be instantiated in a selected data integration technology.
Slide 32: This slide showcases BI Design & Development
Slide 33: This slide shows BI Applications.
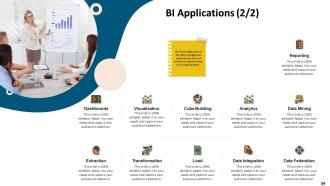
Slide 34: This slide displays BI Applications.
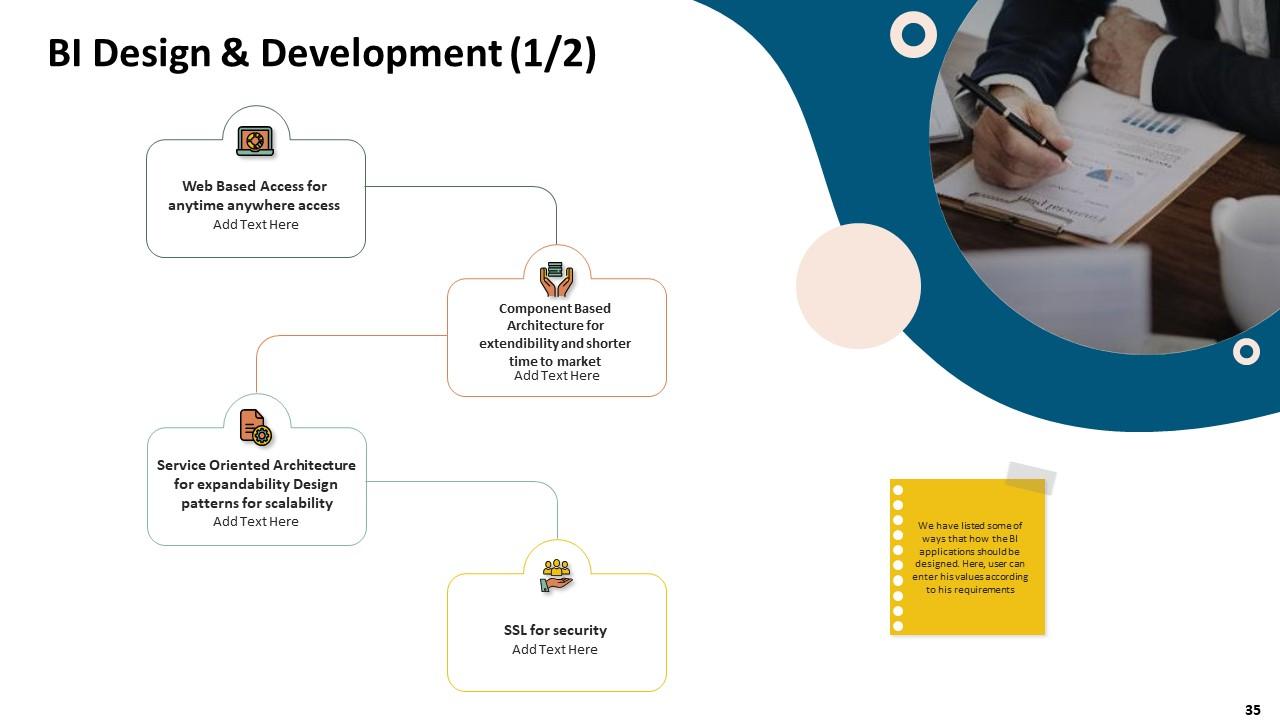
Slide 35: This slide showcases BI Design & Development.
Slide 36: This slide displays BI Design & Development.
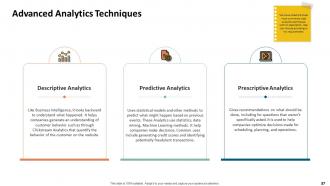
Slide 37: This slide shows Advanced Analytics Techniques.
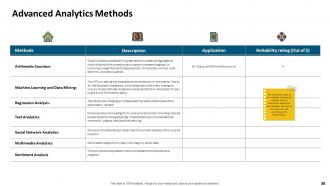
Slide 38: This slide presents Advanced Analytics Methods.
Slide 39: This slide showcases Advanced Analytics Final Output Results.
Slide 40: This slide covers the final outcome result of the advanced analytics. User can edit according to his requirements
Slide 41: This slide showcases Business Intelligence Kpis & Dashboard.
Slide 42: This slide depicts Business Intelligence KPI Metrics.
Slide 43: This slides showcases Business Intelligence KPI Metrics.
Slide 44: This slide shows Business Intelligence KPI Metrics.
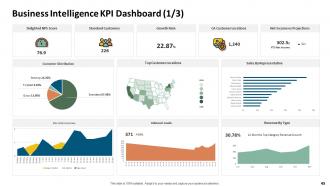
Slide 45: This slide shows Business Intelligence KPI Dashboard.
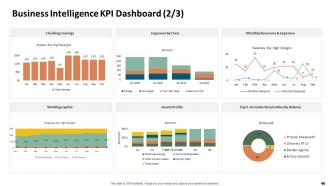
Slide 46: This slide presents Business Intelligence KPI Dashboard.
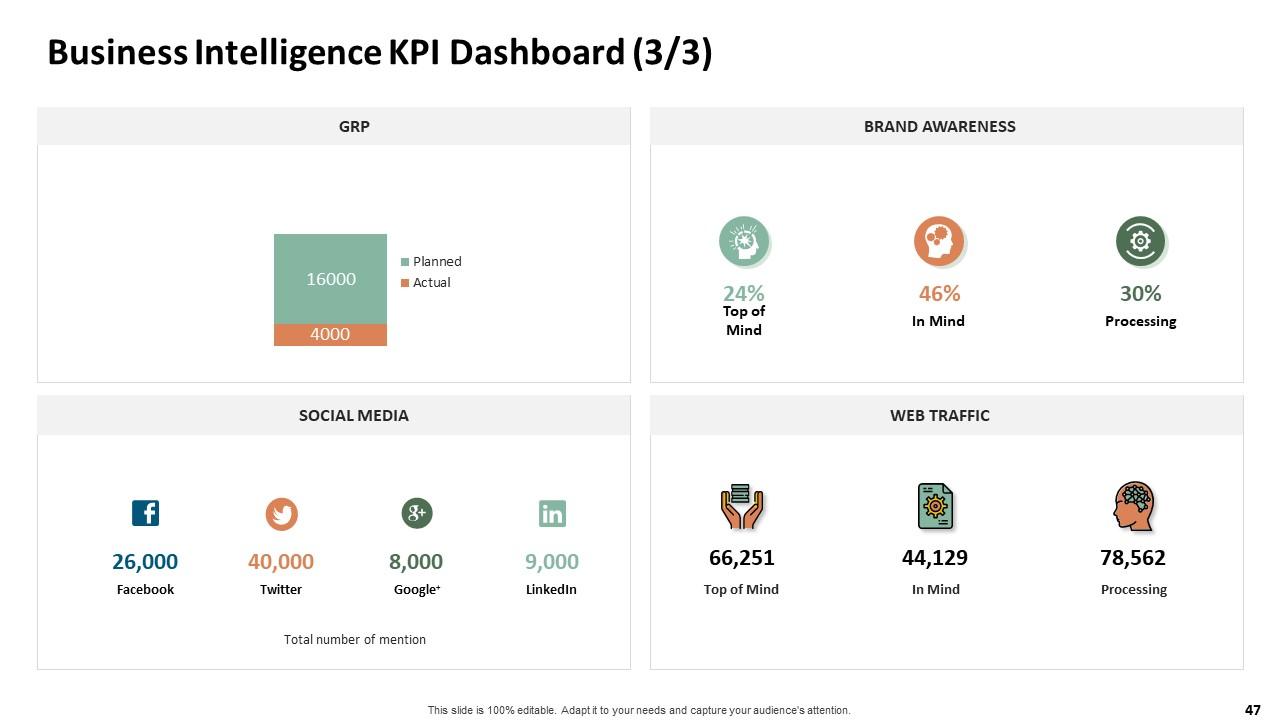
Slide 47: This slide shows Business Intelligence KPI Dashboard
Slide 48: This is Corporate Performance Management Icons Slide.
Slide 49: This slide is titled as Additional Slides for moving forward.
Slide 50: This slide shows Cluster Bar chart.
Slide 51: This slide displays Stacked Column.
Slide 52: This slide displays Mission, Vision and Goals.
Slide 53: This slide shows Magnifying Glass.
Slide 54: This slide displays Venn.
Slide 55: This slide shows Roadmap process.
Slide 56: This slide shows Circular process.
Slide 57: This slide displays Our Goal
Slide 58: This slide shows Idea Generation process.
Slide 59: This slide shows Post It Notes
Slide 60: This slide presents Puzzle process.
Slide 61: This is Thank You slide with Contact details.
Corporate Performance Management Powerpoint Presentation Slides with all 61 slides:
Use our Corporate Performance Management Powerpoint Presentation Slides to effectively help you save your valuable time. They are readymade to fit into any presentation structure.
-
Attractive design and informative presentation.
-
Use of icon with content is very relateable, informative and appealing.
-
Unique research projects to present in meeting.
-
The Designed Graphic are very professional and classic.
-
Great quality slides in rapid time.
-
Use of different colors is good. It's simple and attractive.


