

Cross Functional Org Chart Construction Management Marketing Departments Product





Try Before you Buy Download Free Sample Product
 Impress Your
 Audience
 100%
100% Editable
 Save Hours
 of Time


Our Cross Functional Org Chart Construction Management Marketing Departments Product are topically designed to provide an attractive backdrop to any subject. Use them to look like a presentation pro.
People who downloaded this PowerPoint presentation also viewed the following :
Cross Functional Org Chart Construction Management Marketing Departments Product with all 12 slides:
Use our Cross Functional Org Chart Construction Management Marketing Departments Product to effectively help you save your valuable time. They are readymade to fit into any presentation structure.
-
Cross Functional Org Chart
-
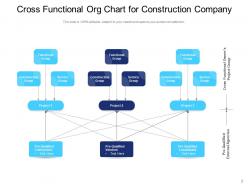
Cross Functional Org Chart for Construction Company
-

Cross Functional Org Chart with Functional Manager
-
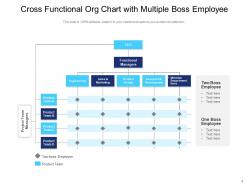
Cross Functional Org Chart with Multiple Boss Employee
-
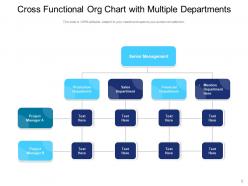
Cross Functional Org Chart with Multiple Departments
-
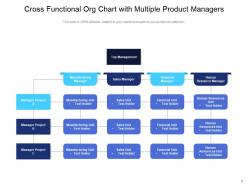
Cross Functional Org Chart with Multiple Product Managers
-
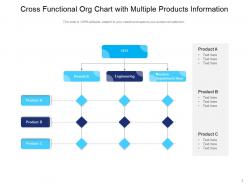
Cross Functional Org Chart with Multiple Products Information
-
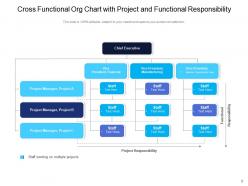
Cross Functional Org Chart with Project and Functional Responsibility
-
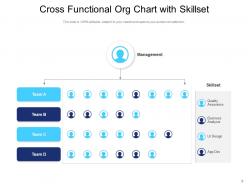
Cross Functional Org Chart with Skillset
-
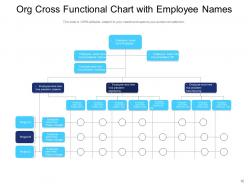
Org Cross Functional Chart with Employee Names
-
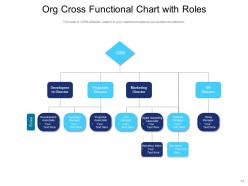
Org Cross Functional Chart with Roles
-

Thank You
FAQs for Cross Functional Org Chart Construction Management
Honestly, the biggest thing you'll notice is how much faster decisions happen when people aren't bouncing ideas up and down some crazy hierarchy. Teams just talk directly to each other. Communication gets way better across departments too - like, marketing actually knows what engineering is working on instead of being completely in the dark. People come up with more creative solutions when they're mixing different perspectives, and everyone starts understanding how their work affects other teams. When priorities change (which they always do), it's not this massive headache because people already know how to collaborate. I'd say pick one cross-functional project first to test it out.
So a cross-functional org chart is basically like mapping out who actually talks to who instead of just the boss hierarchy stuff. You know how you'll waste half a day trying to figure out which person handles what? This fixes that. Like you can see Sarah from marketing works with the product team, or that finance and operations are always coordinating on budgets. Honestly saves so much time when you're not playing email ping-pong trying to find the right person. Next time you're starting a big project, just sketch out the connections - trust me, it's weirdly satisfying once you see it all laid out.
Oh man, role clarity becomes a total mess first - nobody knows who's actually making decisions anymore. Communication gets super complicated when you're trying to coordinate across different teams instead of just your own department. Some managers are gonna fight you hard on this because they don't want to give up control of their little empire. Productivity will probably tank at first while everyone figures out the new workflows. Power struggles are inevitable too, which honestly gets exhausting. I'd say test it out with smaller projects before going all-in, and spend time getting people on board early.
Look, cross-functional org charts basically stop departments from working in their own little worlds and missing obvious stuff. Map out how marketing, engineering, and product actually connect on projects - suddenly everyone knows who to talk to instead of guessing. You'll get way fewer "wait, nobody told me this was happening" disasters. Plus teams can bounce ideas off each other earlier, which honestly saves so much time later. Fresh eyes catch problems before they become expensive headaches. I'd update it every few months though, since teams shift around more than you'd think.
Honestly, your leaders need to get out of the way and let teams actually work together. They should clear roadblocks and make it crystal clear who gets to decide what. The biggest game-changer? Leaders have to stop being territorial themselves - teams pick up on that stuff immediately. Also, don't let departments retreat into their own little worlds. Someone needs to jump in when priorities clash between teams. Oh, and skip the endless approval chains - nothing kills momentum like making people wait weeks for simple decisions. Give them decent tools to stay connected and you're most of the way there.
Honestly, you'll need some kind of digital tool or you'll go insane trying to keep those charts updated manually. I've seen people use Lucidchart or Miro - they sync with HR databases so when someone switches teams, it updates automatically. The cool part is finding tools that show both the official reporting structure AND who actually works with who day-to-day. Those are totally different things, right? Just pick something that plays nice with whatever project management stuff you're already using. Don't get fancy with it at first.
Honestly, forget the traditional department setup - it's kind of outdated anyway. Group people around what they're actually building together. So like, your designer, dev, and product person should all be under "Customer Onboarding" instead of spread across different boxes. Draw dotted lines between teams to show how they talk to each other. Start by mapping your biggest cross-team projects first, then build the chart around those relationships. The whole point is making it super obvious who needs to work together. Makes way more sense than forcing people to collaborate across random silos.
So there's a bunch of stuff you can track to see if it's actually working. Project delivery times are obvious - are things moving faster? Employee satisfaction around collaboration is big too. I'd watch how quickly decisions get made (nobody wants approval hell). Also track things like cross-training participation and how fast teams resolve conflicts when they pop up. Honestly though, the best metric is just asking people directly - do they know who to talk to when they need help? Do they feel connected to the right folks? Maybe start with a quarterly survey to get your baseline, then go from there.
Honestly, I'd check it every 2-3 months if things move fast at your company. Quarterly is the bare minimum. People switch teams constantly, new projects pop up, someone gets promoted - your chart goes stale super quick. I've definitely seen those ancient org charts that make zero sense and just frustrate everyone trying to figure out who does what. The trick is making it routine instead of waiting till someone complains it's totally wrong. Stick a calendar reminder somewhere and get one person to actually own keeping it updated. Otherwise you'll just keep forgetting about it.
Honestly, I'd hit three main things: communication skills, systems thinking, and getting clear on who does what. Most people have zero idea what other departments actually do all day - like marketing folks don't get finance and vice versa. Super annoying but fixable with workshops. Teach them how to run cross-team meetings without everyone wanting to die. Practice real scenarios together since that's the only way it sticks. Oh, and definitely add conflict resolution training because let's be real - when teams overlap, people get territorial and things get messy fast. Role clarity is massive too.
Honestly, cross-functional charts work way better for decision-making than the old pyramid thing. Instead of everything bouncing up and down those corporate silos, you've got direct lines between departments. Way less "hold on, let me ask three people above me" BS. The downside? Sometimes nobody knows who actually makes the final call - that gets messy. But most places I've seen move faster once people figure it out. Oh, and definitely map your big decision points first, then work backwards to see which departments need to talk to each other. Makes the whole setup less chaotic.
Tech and healthcare companies crush it with cross-functional teams. Manufacturing and marketing agencies do great too - basically anywhere you need different skills meshing fast. Finance and legal? They're still pretty old-school about it, honestly. Look, if you're dealing with complex problems, crazy deadlines, or need to innovate constantly, these teams will speed things up. I'd check where your biggest slowdowns happen right now. Bet it's departments waiting on each other to get their act together. That's where cross-functional structure really pays off.
Honestly, most conflicts happen because nobody knows who's doing what. Set up clear roles and communication from day one - saves you so much headache later. I'd also do regular check-ins with department heads to catch problems before they blow up. The real issue comes when marketing wants everything yesterday and engineering's like "but what about quality?" You need escalation paths figured out ahead of time, plus shared goals that actually make sense for everyone. Maybe start by sitting down with your team leads this week and just... walk through the scenarios that'll probably happen. Trust me on this one.
Lucidchart's probably your best bet - great for dotted lines and matrix stuff, plus everyone can collaborate on it. Visio works too if you're already in the Microsoft ecosystem. There's also OrgChart which is more specialized but honestly might be overkill unless you're dealing with a massive company. I've seen people try Google Drawings for simpler orgs and it works okay until things get complicated, then it's just a nightmare to manage. The real trick is making sure whoever needs to update it can actually figure out how to use it. Start with Lucidchart's templates and see how it goes.
Oh definitely add location tags and time zones to your org chart - color coding by office is super helpful. Also throw in how people prefer to communicate because you know there's always that one person who lives in Slack while someone else barely checks email. Miro or Lucidchart are perfect since everyone can jump in and edit stuff. The key thing is showing when people's hours actually overlap for collaboration. I'd probably make smaller charts for specific projects too, shows who's really working together regardless of where they're sitting. Makes everything way clearer honestly.
-
Really like the color and design of the presentation.
-
Great quality slides in rapid time.
-
Excellent Designs.
-
Use of different colors is good. It's simple and attractive.
-
Great designs, really helpful.