

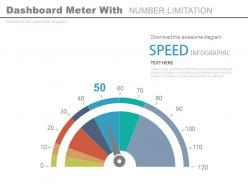
Dashboard Snapshot meter with number limitation powerpoint slides





Try Before you Buy Download Free Sample Product
 Impress Your
Audience
 100%
Editable
 Save Hours
of Time


Demonstrate the concept of business intelligence with our dashboard snapshot meter with number limitation PowerPoint slide. The presentation visual shows the dashboard icon that can assist you to share the complex business data into a meaningful way. Every organization access their performance parameters to ensure better results in the coming year. You may use PPT illustration to highlight the current update of metrics and KPIs for an organization. Presenting the data in the right way is important not only for the growth point of view but also to understand where the improvement is required. Our PowerPoint graphic design enables you to analyze your business in a professional way to your viewers which can be your stakeholders, business partners, team members etc. The management take gets lot of value with it as it makes it possible for them to access the data whenever and wherever required. You may also do so by just downloading it and then incorporating it in your presentation. You may also access our other PPT template designs that can be useful for your industry. Build up their appetite with our Dashboard Meter With Number Limitation Powerpoint Slides. Assure them of a generous helping.
People who downloaded this PowerPoint presentation also viewed the following :
Dashboard Snapshot meter with number limitation powerpoint slides with all 4 slides:
Gain easy access to different avenues with our Dashboard Snapshot Meter With Number Limitation Powerpoint Slides. They always facilitate diversification.


FAQs for Dashboard Snapshot meter with number
Dashboard snapshot meters serve as instant visual indicators that display key performance metrics, real-time status updates, progress toward goals, current system health, and critical threshold alerts. These visualization tools enhance decision-making by providing at-a-glance insights into business performance, with many organizations finding that snapshot meters streamline monitoring processes and accelerate response times to operational changes.
Dashboard snapshot meters deliver real-time, visual data summaries through interactive widgets, graphs, and KPI displays, while traditional reporting tools generate static, periodic documents requiring manual analysis. These modern dashboards enable instant decision-making, automated updates, and dynamic filtering across multiple data sources, with many organizations finding significantly faster insights and enhanced operational responsiveness.
Dashboard snapshot meters present limitations including delayed data refresh rates, static visualization constraints, limited drill-down capabilities, reduced interactivity, and potential data synchronization issues. These challenges can impact decision-making speed in fast-paced environments like financial trading or manufacturing operations, with many organizations finding that supplementing snapshots with dynamic monitoring tools ultimately delivers more responsive analytics and competitive advantage.
Dashboard snapshot meter accuracy can be compromised by outdated data sources, inconsistent refresh rates, incomplete data integration, measurement errors, and poor data quality controls. These limitations particularly affect real-time monitoring in financial services and healthcare settings, where organizations find that implementing robust data validation processes, automated quality checks, and regular calibration ultimately delivers more reliable metrics and better decision-making capabilities.
Dashboard snapshot meters face integration challenges including data format inconsistencies, real-time synchronization delays, API compatibility issues, varying update frequencies, and security protocol conflicts across different systems. These technical hurdles can result in incomplete visualizations, delayed insights, and increased maintenance overhead, though many organizations streamline integration through standardized data pipelines and middleware solutions, ultimately delivering more comprehensive business intelligence.
User interpretation of dashboard snapshot meters can lead to misinformed decisions through oversimplification of complex data, misunderstanding of context behind metrics, and reliance on outdated information without real-time updates. These interpretation challenges often result in hasty strategic pivots, misallocated resources, and overlooked underlying trends, with many organizations finding that supplementing visual meters with detailed analytics ultimately delivers more accurate decision-making and sustainable business outcomes.
Dashboard snapshot meter design significantly impacts usability through visual clarity, data hierarchy, color coding, and intuitive layout that enables quick comprehension of key metrics. Poor design creates cognitive overload and misinterpretation, while well-structured meters with clear labeling, appropriate scaling, and strategic use of visual elements streamline decision-making processes, ultimately delivering faster insights and enhanced operational efficiency across organizations.
Relying solely on snapshot meters creates incomplete performance visibility, missing trend analysis, contextual factors, predictive insights, and real-time anomaly detection capabilities. While snapshot data provides quick status checks, organizations in sectors like retail and healthcare find that comprehensive performance analysis requires continuous monitoring, historical trending, and integrated analytics to deliver accurate decision-making and competitive advantage.
Regional and industry-specific data nuances significantly impact snapshot meter applicability by creating variations in data formats, compliance requirements, measurement standards, and performance benchmarks across different markets. While healthcare organizations may prioritize patient outcome metrics and financial institutions focus on risk indicators, manufacturers emphasize operational efficiency measures, with many organizations finding that customizable meter frameworks deliver more accurate insights than standardized approaches.
Snapshot meters capture data at specific intervals to reveal trends over time, while real-time data provides continuous, immediate insights for instant decision-making. While snapshots excel at identifying patterns, seasonal changes, and long-term performance trajectories across departments, real-time monitoring enables immediate responses to critical situations, with many organizations finding that combining both approaches delivers comprehensive visibility and strategic advantage.
Businesses can mitigate snapshot meter limitations by implementing real-time data integration, establishing automated refresh protocols, combining snapshot data with trend analysis, and creating multi-layered dashboard views. Through strategic data architecture and complementary visualization tools, organizations streamline decision-making processes while maintaining operational transparency, with many finding that hybrid approaches ultimately deliver enhanced accuracy and competitive advantage in dynamic business environments.
**INPUT**: What are the best practices for choosing metrics to display in a dashboard snapshot meter? **OUTPUT**: Best practices include selecting metrics that align with strategic objectives, ensuring real-time relevance, maintaining visual clarity, focusing on actionable insights, and limiting the number of displayed KPIs. These approaches streamline decision-making by emphasizing critical performance indicators, reducing cognitive overload, and enabling quick interpretation, with many organizations finding that well-curated snapshot meters enhance operational efficiency and accelerate response times. [Word count: 58 words]
A well-designed dashboard snapshot meter interface significantly influences user engagement through intuitive navigation, clear visual hierarchy, responsive design, and customizable features that match user workflows. These interface elements enhance user adoption by reducing cognitive load, streamlining decision-making processes, and delivering personalized experiences, with many organizations finding that thoughtful UI design ultimately drives higher utilization rates and improved business outcomes.
**INPUT**: Are there any technological advancements improving the functionality of dashboard snapshot meters? **OUTPUT**: Yes, several technological advancements are enhancing dashboard snapshot meters, including real-time data processing, AI-powered analytics, cloud integration, mobile responsiveness, and automated alert systems. These innovations streamline data visualization by delivering faster updates, predictive insights, and seamless cross-platform access, with many organizations finding that enhanced snapshot capabilities ultimately improve decision-making speed and operational efficiency. [Word count: 58 words]
Dashboard snapshot meters can amplify cognitive biases including anchoring bias, where initial metrics overly influence decisions, confirmation bias through selective data focus, and recency bias by emphasizing current snapshots over trends. These visualization tools, while streamlining data presentation, may inadvertently narrow decision-making scope by encouraging quick judgments based on limited timeframes, with many organizations finding that balanced dashboards incorporating historical context and multiple data perspectives ultimately deliver more comprehensive strategic insights.
-
Very nice
-
Innovative and attractive designs.
-
Illustrative design with editable content. Exceptional value for money. Highly pleased with the product.