

 Customer Reviews
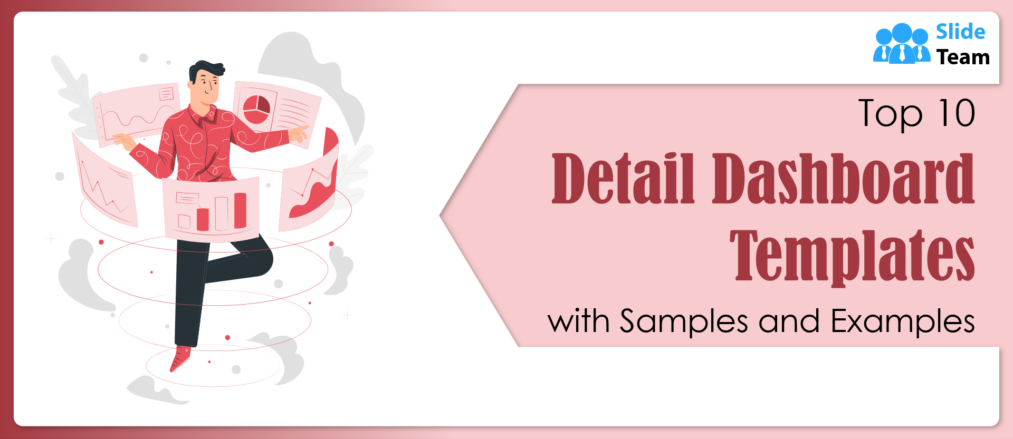
"Simplicity is the ultimate sophistication"-Leonardo da Vinci
This saying remains relevant even today. This is because our every click, swipe, and action contributes to the ever-growing sea of data and its complexity. Hence, pursuing simplicity is not merely a preference but a vital requirement.
This is where detail dashboards come into play. They transform vast and complicated datasets into visuals that communicate information more effectively than plain text.
However, it's important to note that not all dashboards are equally useful. SlideTeam's detailed dashboards, for instance, are a step above as they pay close attention to details. Additionally, these designs ensure that information is displayed and a unique story is told with precision and style. Whether revealing hidden trends or emphasizing important data points, these dashboards are created to make complex information easy to understand and accessible.
Think your company deserves a standing ovation? Craft a presentation that steals the show with our award-winning company detail templates!
After all, in the art of data, simplicity isn't just sophistication; it's everything.
Let’s begin!
Want your project to be a masterpiece, not a muddle? Download our project brief templates and set the stage for success. Click to know more!
Template 1: Goal Detail and Progress Status Dashboard
Stay on top of your organization's goal progression with the help of this meticulously crafted dashboard design. This dashboard boasts dynamic visual representations of critical insights, including the total number of active goals, aligned goals, overall progress, and more. Stakeholders will appreciate the real-time updates, providing a clear and transparent view of the status of each goal. This visibility enables quick corrective actions if any goals veer off course, ensuring that every team's efforts remain aligned with the organization's overarching objectives. With this dashboard, you'll have the tools to keep your organization on the path to success.

Template 2: Detailed Metrics Dashboard for Omnichannel Model
This PPT provides a holistic view of your company's performance across multiple consumer touchpoints. Dive into detailed analytics covering customer engagement, conversion rates, and sales metrics, all segmented by online, in-store, mobile channels, and more. This dashboard combines data from multiple sources, providing valuable insights. Utilize these insights to enhance the performance of each channel and create a uniform customer experience. This also helps in crafting a cohesive and influential brand strategy to make informed decisions and achieve business goals with ease.

Template 3: Agile Project Status Dashboard with Story Details Summary
Meet the dynamic needs of your agile team with this versatile design. It offers a holistic perspective on sprint progress, completed tasks, achieved story points, backlog status, etc. This template empowers users to generate in-depth summaries of ongoing sprints and projects, covering crucial aspects such as risk assessment, mitigation strategies, team velocity, and more. Therefore, with this tool in their arsenal, teams can adapt to changes, prioritize tasks, and maintain consistent alignment throughout their projects. Download now!

Template 4: Sales Order Fulfillment Planning Dashboard with Customer Account Details
Simplify and optimize your sales order management and customer account monitoring with the help of this PowerPoint template. This resource provides comprehensive insights across various aspects of your business, including order statuses, inventory levels, and customer account activities. With its detailed information on shipping schedules, order accuracy, and customer satisfaction metrics, the dashboard is an invaluable resource for companies looking to improve their logistics, bolster customer relationships, and increase sales. Utilize this template to make informed decisions, monitor performance, and ultimately propel your operations toward success. Don't miss out on this opportunity – grab it now!

Template 5: HR KPI Dashboard with Employee Salary Details
Simplify your HR metrics management with our specialized KPI Dashboard. This helpful tool doesn't stop at the basics. It gives you a detailed look at how salaries are spread out, how many people are leaving, who's in permanent positions, where benefits are going, and pay trends. Plus, it shows all of this in an easy-to-understand way. This dashboard helps HR professionals make smart choices that affect the company's success. It's great for adjusting pay to attract and keep the best people and ensuring everyone stays motivated. With all this HR data in one place, you'll be better prepared to manage your company's most valuable resource – its employees.

Template 6: Human Resources Detailed Analytics Report Dashboard
This handy PPT Slide gives you a detailed view of how well hiring is going, which job roles are popular, how many employees are leaving, and how everyone's doing in their evaluations. It's made to make complicated HR data easy to understand and act upon. With this information, HR managers can create effective plans for finding new talent, helping employees grow, and keeping them engaged. This dashboard is thus a valuable tool for making decisions based on data and helping the whole organization succeed.

Template 7: Procurement Dashboard Report with Sourcing Details
Improve your buying process with our Procurement Dashboard Report. It's like a smart tool that gives you lots of information about how well your suppliers follow the rules, what types of things you buy, how long it takes to buy stuff, and more. This dashboard also helps you see important things like where you can save money, how to handle supplier risks, and making sure your orders are right. It gives power to the people who buy things to make good choices, work better with suppliers, and make buying things faster and cheaper, saving money and making the supply chain work better.

Template 8: Insurance Claims Details Dashboard
This user-friendly dashboard offers a comprehensive overview of the insurance claims process. It delves into the status of insurance claims, and their processing efficiency and gathers valuable customer feedback. It also simplifies monitoring the volume of claims, tracking how swiftly they are being processed, and determining the rate at which they are successfully resolved. This dashboard becomes an invaluable tool for insurance companies by providing such insights. Grab it now!

Template 9: Education KPI Dashboard with College Details
Give educational administrators the tools they need with our Education KPI Dashboard. It displays crucial data like admissions, student enrollment, faculty performance, and financial health. This dashboard offers important information about how well students are doing, how effective programs are, and how resources are managed. It helps educational leaders make smart choices. It's a crucial tool for improving education, improving student results, and running things smoothly. With this detailed education data, schools can better serve students, teachers, and everyone involved, leading to more success and excellence in education.

Template 10: IT Project Detail Dashboard
This versatile tool gives you a complete picture of your project – timelines, budgets, resources, and potential risks. It focuses on important measures like tasks running late, reaching milestones, and any issues that might slow down the project. IT managers use this dashboard to keep projects on schedule, use resources wisely, and ensure IT projects match the company's big goals. It's like a guiding light for IT teams, helping them stay on course and finish projects successfully while keeping risks low and resources well-used.

Template 11: Employee Payroll Details Dashboard
Make payroll management easier with our user-friendly employee dashboard. This tool covers various payroll aspects, including employee data, salaries, taxes, and bonuses. It ensures accurate calculations, follows regulations, and pays on time, keeping employees happy and finances in order. This essential resource also empowers HR and finance professionals to manage payroll efficiently, fostering a positive workplace and contributing to employees' financial well-being. It boosts employee trust, morale, job satisfaction, and productivity. Additionally, it helps in tax compliance, avoiding penalties and payroll errors.

Over To You
As we bid farewell to traditional and obsolete data visualization methods, we welcome a future where the Detail Dashboard reigns supreme. It's more than a dashboard; it's an innovative masterpiece that simplifies complexity and paints a clearer picture of our data-driven world.
Let's celebrate detail dashboards as a symbol of simplicity and sophistication in the data realm, guiding us towards a brighter, more data-savvy future.
P.S. Stuck in information silos? Say goodbye to them with our tracker dashboards that consolidate data from multiple sources into a unified view!


![[Updated 2023] A Quick Guide to Sprint Planning (With 15 Templates to Help You Achieve Your Goals)](https://www.slideteam.net/wp/wp-content/uploads/2021/12/Sprint-Planning_2-1013x441.png)