


Data Quality Metrics Score For Reports Monitoring




Try Before you Buy Download Free Sample Product
 Impress Your
 Audience
 100%
100% Editable
 Save Hours
 of Time


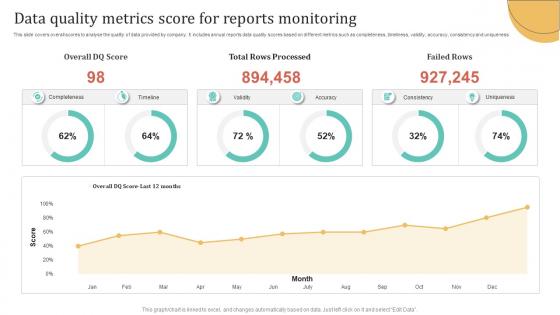
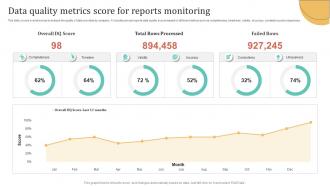
This slide covers overall scores to analyse the quality of data provided by company. It includes annual reports data quality scores based on different metrics such as completeness, timeliness, validity, accuracy, consistency and uniqueness.
People who downloaded this PowerPoint presentation also viewed the following :
Data Quality Metrics Score For Reports Monitoring with all 7 slides:
Use our Data Quality Metrics Score For Reports Monitoring to effectively help you save your valuable time. They are readymade to fit into any presentation structure.





FAQs for Data Quality Metrics Score
You'll want to focus on accuracy, completeness, consistency, timeliness, validity, and uniqueness. Accuracy shows if your data matches reality. Missing values? That's completeness. Consistency makes sure everything aligns across different systems. Timeliness is crucial - old data is basically useless for making decisions. Validity confirms your data follows the right business rules and formats, while uniqueness spots those annoying duplicates that screw up your analysis. Here's the thing though: most teams go overboard trying to monitor everything and just get overwhelmed. Pick 2-3 dimensions that actually solve your biggest headaches first, then build from there.
Start with your most critical data - you can't check everything at once anyway. Compare against trusted external sources or create "golden records" as your baseline. Random sampling works really well too; just manually verify a subset and calculate your accuracy percentage. Set up validation rules for obvious stuff like impossible dates or values that don't make sense. Cross-checking duplicates is clutch since they'll often have conflicting info. I know it's tedious as hell, but tracking accuracy over time helps you spot when things are getting worse. The statistical approach saves you tons of manual work.
Data completeness is like the foundation everything else sits on - missing chunks of info make your other metrics pretty useless. It's kinda like grading a test with half the answers blank, you know? I'd start by figuring out which fields actually matter, then track completeness percentages for those. Honestly, anything under 95% is usually a red flag that something's broken in your data collection process. Once you spot the gaps, you can work backwards to see what went wrong upstream. Makes way more sense than trying to measure accuracy on incomplete data first.
Start with consistency rules - standardized date formats, customer IDs, that sort of thing. Automated profiling tools can scan for inconsistencies and show you variance percentages between systems. Cross-system mapping is helpful but honestly kind of a nightmare to set up at first. I'd focus on your most critical data elements before expanding. The real trick is getting those baseline metrics so you can actually see if you're improving over time. Plus it helps you figure out which inconsistencies are worth fixing first vs. the ones that can wait.
Monte Carlo and Great Expectations are solid choices for data observability - they're literally made for this. Your data warehouse probably has monitoring built in too. Snowflake and BigQuery will ping you when ETL jobs are late or data gets stale. But honestly? Simple SQL queries checking last_updated timestamps work great when you're getting started. Way better than staring at dashboards all day waiting for something to break. Set up some automated alerts and call it good. You can always get fancier later once you figure out what actually matters for your setup.
Think of data validation as your quality control checkpoint - it stops bad data from screwing up your analytics later. You'll want to check for completeness, accuracy, all that stuff. Honestly, the more validation rules you set up, the better your quality scores get. I always tell people to track validation failure rates right next to your regular metrics. That combo gives you a way clearer view of where things are actually falling apart in your pipeline. It's pretty straightforward once you get the hang of it.
Bad data is honestly the worst - you'll make terrible decisions and waste so much money. Like, imagine launching a product based on garbage info that nobody actually wants. Inconsistent or outdated data means you're basically flying blind when spotting trends or predicting what'll happen next. I've seen companies miss huge opportunities because their numbers were just wrong. Clean data though? Game changer. You can actually trust your insights and present stuff to your boss with confidence. Start with whatever datasets directly hit your revenue first - that's where it hurts most if you screw up.
Start with data quality rules for your most important stuff - completeness, accuracy, consistency thresholds. Great Expectations works well, or just use whatever your cloud provider has built-in. Honestly, the biggest mistake is trying to monitor everything from day one. You'll drown in alerts. Focus on the data that actually matters for business decisions first. Set up automated checks in your pipelines so you catch problems early instead of finding out later. Build it out gradually - way less headache that way.
Honestly, the hardest part is getting everyone to agree on what "quality" even means for each dataset - good luck with that mess! You'll also hit issues with inconsistent definitions between teams and no real standardized way to measure stuff. The data volumes are insane too, which makes checking everything super difficult. Real-time monitoring vs batch processing becomes this whole trade-off situation. And measuring subjective things like "relevance"? Forget about it. My take: just pick a few critical metrics that won't cause fights, then slowly add more once people actually trust the system.
So data lineage is basically your detective tool for tracking down where stuff went wrong. You spot bad data? Follow it backwards through every system and transformation until you find the actual source. Way better than just fixing the mess at the end, you know? Like, you can pinpoint exactly where duplicates got introduced or null values started showing up. Honestly, it saves so much time once you get it set up. Just start with your most important data flows first - don't try to map everything at once or you'll go crazy.
Usage data tells you everything about data quality, honestly. When datasets just sit there unused, there's probably something wrong - bad accuracy, missing info, whatever. People basically vote with their clicks. High usage means they trust it. Track stuff like how often datasets get queried, adoption rates, and references in reports. Oh and watch for sudden drops - that's your canary in the coal mine moment. Users bail when quality tanks. It's actually pretty reliable as an early warning system, way better than waiting for formal complaints.
Honestly, regulations are a pain but they force you to keep your data way cleaner than you'd probably bother with otherwise. GDPR makes you get personal info right. Financial stuff? Those transaction records better be perfect or you're screwed. Healthcare is brutal with HIPAA - like, everything has to be locked down. But here's the thing - it actually makes your data better in the long run. You just gotta figure out which rules apply to your industry first. Then match your quality metrics to whatever accuracy and timing standards they're demanding. Sounds obvious but most people skip that step.
Focus on what actually breaks your business, not vanity metrics. Healthcare? Track medication error rates - that's life or death stuff. Financial companies obsess over regulatory compliance scores because fines hurt. Retail needs accurate product catalogs (ghost inventory kills margins fast). Manufacturing watches sensor reliability religiously. Here's what I'd do: map your most critical processes first. Then figure out which data failures would make your executives freak out. Honestly, most companies track way too much. Pick 3-5 metrics that would actually matter if they went sideways. That's it.
Get regular feedback from your stakeholders - like quarterly sessions or quick surveys where they can vent about data issues they're actually dealing with. Trust me, their complaints are pure gold for figuring out what really matters. When someone says "customer emails are always wrong," boom - start tracking email validation rates. Map their specific pain points to actual numbers you can measure. Oh, and this part's crucial: circle back and show them how things improved based on what they told you. Otherwise they'll think you're just collecting feedback to ignore it.
Honestly, you gotta build this stuff in from the start - don't just slap it on later. Get automated alerts running so you're not blindsided by garbage data. Make sure someone actually owns each dataset (otherwise it's nobody's problem, you know?). Document where your data comes from and how it moves around - sounds tedious but you'll thank yourself later. The governance piece is boring as hell but necessary. Train people on your standards and stick to them. Regular check-ups help catch problems early. Oh, and get your executives on board first thing - these projects die quick without leadership backing. Start with your most important data and build out.
-
Innovative and creative templates with high-quality designs. Helped me with my presentation as the slides were easy to edit.
-
Extremely professional slides with attractive designs. I especially appreciate how easily they can be modified and come in different colors, shapes, and sizes!