


Database Relationship Diagram For Passport Automation System




Try Before you Buy Download Free Sample Product
 Impress Your
 Audience
 100%
100% Editable
 Save Hours
 of Time


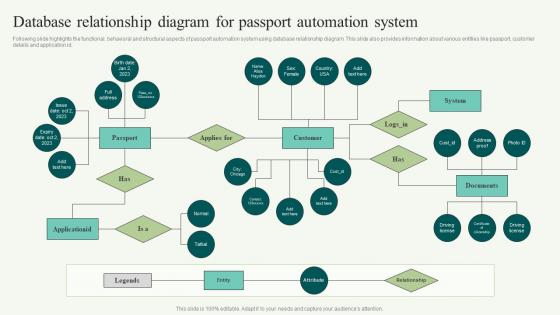
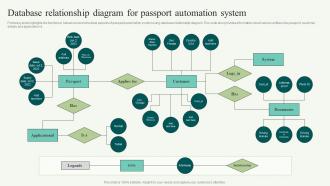
Following slide highlights the functional, behavioral and structural aspects of passport automation system using database relationship diagram. This slide also provides information about various entities like passport, customer details and application id.
People who downloaded this PowerPoint presentation also viewed the following :
Database Relationship Diagram For Passport Automation System with all 6 slides:
Use our Database Relationship Diagram For Passport Automation System to effectively help you save your valuable time. They are readymade to fit into any presentation structure.





FAQs for Database Relationship Diagram For
So DRDs basically show you entities (like "Customer" or "Product"), their attributes, and how they connect to each other. Look for primary keys, foreign keys, and those little symbols that tell you if it's one-to-one or one-to-many relationships. Honestly took me forever to figure out what all the squiggly lines meant at first. But once you get it, it's like having a map of your whole database. Start with identifying the main entities, then just follow the relationship lines to see how data moves around. Way easier than it looks initially.
So basically, ERDs are what you sketch out during planning - like "what data do we need and how does it connect?" DRDs show the actual database after it's built. Foreign keys, junction tables, all that real stuff. Honestly though? People mix up these terms constantly, which is super annoying when you're trying to learn. I'd go with a DRD if you're documenting something that already exists. Your developers will thank you since they can see the actual table relationships they're working with. ERDs are more theoretical - good for the brainstorming phase but not as useful day-to-day.
Honestly, you'll want one anytime you're dealing with more than 3-4 connected tables. If you're building something new or trying to make sense of someone else's database nightmare, a DRD saves your sanity. Stakeholders love them too since they can actually see what's going on without getting lost in technical stuff. They're super helpful when scaling up or hunting down those annoying data integrity bugs. Trust me, once relationships get complex, you're basically guessing without a visual map. I learned this the hard way on a project last year. Sketch one out early - future you will be grateful.
So there are basically three types of relationships you'll see in database diagrams. One-to-one is rare - like a person with one passport. Most of the time you're dealing with one-to-many, where one customer has multiple orders or whatever. Many-to-many gets tricky though. You need a junction table to handle it properly - students taking multiple classes, classes having multiple students, that whole mess. Honestly, I'd start by just looking at your actual data and figuring out these patterns first. The technical stuff comes after you understand what you're actually trying to connect.
So cardinality is basically asking "how many?" - like is it one-to-one, one-to-many, that kind of thing. You show this with symbols next to the relationship lines (crow's feet and all that). Participation constraints are different though - they tell you if something HAS to be in the relationship or not. Total participation means every single instance needs to be involved. Partial means some can sit it out. The notation changes depending on what software you're using, which is honestly pretty frustrating. But yeah, when you're building your ERD just think: how many entities can connect, and is it required?
Honestly, I'd just start with draw.io - it's free and does pretty much everything you need. Lucidchart's another good web option if you're working with other people. MySQL Workbench is clutch because it can pull diagrams straight from your existing database (total lifesaver). Visio still gets used a lot at bigger companies but feels kinda clunky now. I've even seen people mock stuff up in Figma which... actually works better than you'd think? pgAdmin's solid too if you're on Postgres. Really depends what you're building, but draw.io covers like 90% of cases.
So you'll basically convert each entity into its own table - just make the attributes into columns. Pretty simple at first. The relationships are where it gets interesting though. For one-to-many, stick a foreign key in the "many" side table. Many-to-many relationships? You'll need junction tables for those (honestly the most annoying part). Make sure you've got your primary keys sorted and pick decent data types for everything. Oh, and set up your constraints too - that'll save you headaches later. The performance optimization stuff comes after, but nailing this basic structure from your DRD is what matters right now.
So normalization basically tells you how to split up your data across different tables in your ERD. You start with 1NF to get rid of repeating stuff, then 2NF handles partial dependencies, and 3NF cuts out transitive ones. Honestly, the names sound way scarier than they actually are. Each piece of data should only live in one spot - that's the whole point. This naturally creates those foreign key connections you see linking everything together. Just start messy with your entities all thrown together, then use the normal forms to figure out how to break them apart properly.
Ugh, don't throw every single column on there - you'll end up with a total mess. Just stick to primary keys, foreign keys, and maybe a couple important attributes for context. I've seen diagrams that look like someone sneezed lines everywhere, it's ridiculous. Show your cardinality properly too - like is it one-to-many or what? Keep entity names matching your actual database (seems obvious but people mess this up). Oh and start simple first. You can always add more complexity later if you need it. Makes the whole thing way cleaner.
So DRDs are honestly a lifesaver - they give your whole team the exact same visual map of how your database is structured. No more awkward meetings where everyone's confused about how tables connect or which foreign keys go where. Developers, analysts, whoever - you're all looking at the same picture instead of having totally different ideas in your heads. New people can jump in way faster too since they see everything laid out. I learned this the hard way after way too many "wait, which table was that again?" conversations. Just keep it updated or it becomes useless pretty quick.
Honestly, DRDs are lifesavers for catching performance issues early. You'll spot those messy many-to-many relationships that need junction tables, plus missing indexes on foreign keys before they bite you. Think of it like sketching your house layout first - way better than tearing down walls later. The visual also shows which tables will get hammered by joins, so you can plan your indexing smartly. I always start with mapping current relationships and hunt for the ugliest spots first. Those are usually where your biggest headaches hide.
So basically you need a junction table - that's the table that sits between your two main ones. Like if you've got Students and Courses, you'd make a StudentCourses table with foreign keys to both. It breaks the messy many-to-many into two simple one-to-many relationships. Way cleaner that way. You can throw extra stuff in there too, like when they enrolled or what grade they got. I always forget this part but - every many-to-many needs that middle table or it just won't work. Once you do it a few times it becomes second nature.
Keep your DRD docs simple but complete. Version history with dates and changes is clutch. Label everything clearly - entities, relationships, cardinalities. Trust me, diagrams turn into puzzles after six months when nobody remembers what they mean. Brief descriptions help for weird business rules that aren't obvious. Stick it all in Confluence or your team wiki. Export the editable file AND a PDF. Oh, and definitely assign someone to actually update it when schemas change. Beautiful but wrong documentation is honestly worse than no documentation.
Honestly, you'll figure it out pretty quick when stuff starts feeling messy. Like if you're cramming customer addresses into your order table - that's a red flag right there. I always look for attributes that seem out of place or don't really describe the main thing. Many-to-many relationships are dead giveaways too since they need junction tables. Here's what I do: list out everything you need to store, then see what naturally belongs together. If something feels forced or you're repeating data, split it up. Trust your gut on this one.
So you know how Chen notation and crow's foot diagrams work? That's your best bet right there. When everyone uses the same symbols, nobody wastes time trying to figure out what Bob's weird squiggly lines actually mean. Trust me, I've been there - spent way too long staring at someone's "creative" ERD once. Your team will read these way faster when you stick to standard UML or ERD conventions. Plus when new people join or others leave, the documentation doesn't become this mysterious puzzle. It's honestly just easier for everyone.
-
SlideTeam is my go-to resource for professional PPT templates. They have an exhaustive library, giving you the option to download the best slide!
-
You know what? I'm so glad I opted for this PPT design. It has been a total game-changer for me and my presentations. Thank you!