


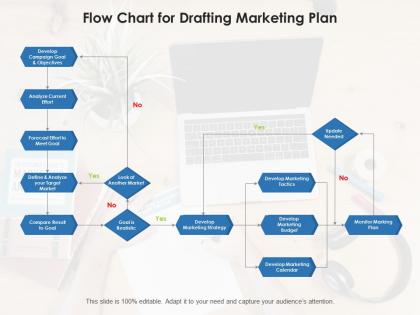
Flow chart for drafting marketing plan




Try Before you Buy Download Free Sample Product
 Impress Your
 Audience
 100%
100% Editable
 Save Hours
 of Time


Our Flow Chart for Drafting Marketing Plan are topically designed to provide an attractive backdrop to any subject. Use them to look like a presentation pro.
People who downloaded this PowerPoint presentation also viewed the following :
Flow chart for drafting marketing plan with all 2 slides:
Use our Flow Chart for Drafting Marketing Plan to effectively help you save your valuable time. They are readymade to fit into any presentation structure.

FAQs for Flow chart for
Key components of an effective marketing plan flow chart include market analysis, target audience identification, goal setting, strategy development, tactical implementation, budget allocation, and performance measurement phases. These interconnected elements streamline campaign planning by establishing clear timelines, resource requirements, and decision points, with many marketing teams finding that visual workflows enhance coordination, minimize oversights, and ultimately deliver more consistent campaign outcomes across multiple channels.
Visual elements in marketing strategy flow charts enhance understanding by transforming complex campaigns into digestible pathways through color coding, icons, shapes, and directional arrows that clarify decision points and processes. These design components enable marketing teams to quickly identify bottlenecks, track customer journeys, and communicate strategic initiatives across departments, ultimately streamlining campaign execution and improving stakeholder alignment.
Common mistakes include creating overly complex flows, failing to define clear success metrics, neglecting feedback loops, skipping stakeholder input phases, and omitting contingency pathways for campaign adjustments. These oversights often result in rigid plans that can't adapt to market changes, with many marketing teams finding that simplified, measurable workflows ultimately deliver better campaign performance and strategic agility.
A marketing plan flow chart facilitates communication by providing visual clarity of roles, responsibilities, timelines, and interdependencies across all marketing activities. This structured approach enables teams to identify bottlenecks, coordinate campaigns more effectively, and maintain alignment on objectives, while ensuring seamless handoffs between departments like creative, analytics, and sales teams.
Marketing plan flow chart software tools include Lucidchart, Microsoft Visio, Canva, Miro, and Draw.io, each offering specialized features for strategic planning visualization. These platforms streamline campaign mapping by enabling collaborative editing, template libraries, and real-time updates, with many marketing teams finding that visual workflow tools enhance cross-departmental alignment and accelerate campaign execution timelines.
A flow chart helps identify target audiences efficiently by mapping customer demographics, behaviors, preferences, and decision-making pathways through visual decision trees and segmentation criteria. This systematic approach enables marketing teams to categorize prospects more accurately, streamline audience research processes, and develop targeted campaigns faster, with many organizations finding that structured audience mapping reduces campaign development time while improving conversion rates.
Data analysis serves as the foundation for marketing plan flow charts by informing target audience segmentation, channel selection, budget allocation, performance metrics, and decision points throughout the customer journey. Through comprehensive data insights, marketing teams can create more precise flow charts that streamline campaign execution, optimize resource distribution, and enhance customer experiences, ultimately delivering measurable ROI and competitive advantage in increasingly data-driven markets.
A marketing plan flow chart enables campaign performance tracking by mapping key performance indicators, milestone checkpoints, conversion funnels, and decision points throughout each campaign stage. Through visual progress monitoring, marketing teams can identify bottlenecks, measure ROI at critical junctions, and pivot strategies in real-time, with many organizations finding that structured tracking ultimately delivers faster optimization and improved campaign outcomes.
Integrating feedback loops in marketing plan flow charts enables continuous optimization, real-time performance monitoring, improved campaign effectiveness, enhanced customer targeting, and faster strategic pivots. Through automated data collection and analysis, organizations streamline their marketing operations, reduce wasted spend, and deliver more personalized customer experiences, with many companies finding that integrated feedback systems ultimately enhance ROI and competitive positioning.
Flow charts aid alignment by visually mapping how marketing activities directly support business objectives, creating clear connections between tactical campaigns, strategic initiatives, and revenue targets. Through structured visualization, marketing teams can identify gaps, eliminate redundant efforts, and ensure resource allocation drives measurable business outcomes, with many organizations finding that this systematic approach enhances cross-departmental collaboration and strategic focus.
Successful marketing campaigns use flow charts for customer journey mapping, email automation sequences, social media content calendars, lead nurturing workflows, and campaign approval processes. Companies like Amazon leverage automated email flows based on browsing behavior, while retail brands use decision trees for personalized product recommendations, ultimately streamlining campaign execution and improving conversion rates across multiple touchpoints.
Seasonal trends significantly reshape marketing plan flow charts by requiring flexible timeline adjustments, budget reallocation phases, and campaign intensity variations throughout different periods. These adaptations enable businesses to capitalize on peak seasons like holidays or back-to-school periods, while maintaining strategic momentum during slower months, ultimately delivering optimized resource allocation and enhanced customer engagement across annual cycles.
**INPUT**: What techniques can be used to make a marketing plan flow chart more engaging? **OUTPUT**: Engaging marketing plan flow charts incorporate visual hierarchy through color coding, interactive elements, compelling icons, clear typography, and strategic white space management. These design techniques streamline complex marketing processes by enhancing readability, improving stakeholder comprehension, and facilitating team collaboration, with many organizations finding that visually optimized flow charts ultimately deliver faster decision-making and stronger campaign alignment. **Word count: 58 words**
Marketing plan flow charts should be updated quarterly as a baseline, with additional revisions triggered by market shifts, campaign performance data, seasonal changes, or strategic pivots. Many organizations find that agile marketing approaches require monthly micro-adjustments to tactics and messaging, while maintaining quarterly strategic reviews, ultimately enabling faster response to market opportunities and competitive threats.
Storytelling transforms marketing plan flow charts from static processes into compelling narratives that demonstrate customer journey progression, stakeholder engagement strategies, and measurable business outcomes. Through narrative frameworks, organizations enhance stakeholder buy-in, improve strategy comprehension, and accelerate implementation timelines, with many marketing teams finding that story-driven presentations ultimately deliver stronger campaign alignment and measurable ROI improvements.
-
Best way of representation of the topic.