

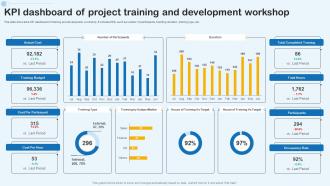
KPI Dashboard Of Project Training And Development Workshop





Try Before you Buy Download Free Sample Product
 Impress Your
Audience
 100%
Editable
 Save Hours
of Time


This slide shows the KPI dashboard of training and development workshop.It includes KPIs such as number of participants, training duration, training type, etc.
People who downloaded this PowerPoint presentation also viewed the following :
KPI Dashboard Of Project Training And Development Workshop with all 7 slides:
Use our KPI Dashboard Of Project Training And Development Workshop to effectively help you save your valuable time. They are readymade to fit into any presentation structure.






FAQs for KPI Dashboard Of Project Training
Honestly, keep it simple - pick 5-7 metrics that actually drive decisions your team makes every day. More than that and people just ignore it. Make sure the data updates automatically because nobody wants to be that person still copying numbers from Excel spreadsheets. Design matters too - if someone has to squint at your charts, you've already lost them. Add context like targets or trends so people can tell at a glance whether things are going well or terribly. I learned this the hard way after building dashboards that looked pretty but told us nothing useful. Start with what decisions you're trying to make, then work backwards from there.
First thing - get your data connected directly to live systems. Manual uploads are the devil, they just sit there getting old while everyone makes decisions off stale numbers. Set up automated pulls based on what actually changes - daily sales need daily updates, but quarterly stuff can wait. Makes sense, right? Here's what I learned the hard way though: audit your metrics every few months. Dashboards get bloated with stuff that felt crucial six months ago but nobody looks at anymore. Keep it tight, focused on what actually drives decisions. Oh, and definitely show when data was last refreshed. Trust me on that one.
Honestly, just talk to each group first and figure out what decisions they're actually trying to make. Executives want the big picture stuff - trends, strategic metrics. Your ops teams need the nitty-gritty details they can act on. But here's the thing - don't go crazy with like 50 different charts because nobody has time for that mess. Stick with consistent colors and layouts so people aren't relearning your design every time. Short sentences work. Also add context - targets, benchmarks, comparisons. Raw numbers by themselves are basically worthless. Each dashboard should feel custom-built for whoever's using it.
So basically, you want your dashboard to tell a story instead of just dumping numbers everywhere. Color coding is your friend - red screams "fix this now" while green means you're crushing it. Charts beat the hell out of staring at endless spreadsheet rows (seriously, who has time for that?). Don't go crazy with fancy visuals though - too much stuff just becomes visual chaos. Pick the right chart for each metric and make sure it actually loads quickly. I'd start with your top 5 KPIs first, then mess around with different formats until something feels right.
Tableau and Power BI are your best bets here - both connect to live data pretty seamlessly. Power BI's probably cheaper if cost matters. Looker's solid too, especially if you're already using Google stuff. I used to torture myself making Excel charts look decent... such a waste of time when these tools exist! Grafana's worth checking out if you're technical and want free/open-source. Really though, just grab free trials of Tableau and Power BI first. See which one doesn't make you want to throw your laptop. The main thing is finding something that actually talks to your data without being a nightmare to set up.
First thing - map each KPI straight to what you're actually trying to accomplish. Don't fall into the vanity metrics trap (been there, done that). Track stuff that lets you pivot early, not just the backwards-looking numbers. Honestly, most teams pick way too many metrics. Stick to 5-7 max per goal or you'll get overwhelmed. Each one needs an owner and realistic targets. I'd start with your top 3 priorities first. Way easier to build momentum that way, then add more later.
User feedback is honestly the only way to know if your dashboard actually works. I've watched so many pretty dashboards just collect dust because nobody finds them useful. Your users will straight up tell you which metrics they skip over and what's driving them crazy. Monthly check-ins work well - just ask specific stuff like "what takes forever to find?" instead of vague questions. They'll point out slow loading, confusing charts, or KPIs that don't match their real workflow. Sounds obvious but you'd be surprised how many people skip this step and wonder why adoption sucks.
Start with clean data sources - garbage in, garbage out, you know? Set up automated rules to catch outliers and missing stuff. Regular audits are clutch for spot-checking your numbers. Oh and definitely assign someone to own each metric because otherwise nobody's accountable when things go sideways. I've watched teams get totally screwed by pulling from some ancient database that hadn't been updated in months. Build these checks into your workflow from the beginning. Way easier than trying to clean up a mess later - trust me on that one.
Don't cram everything onto one dashboard - it just becomes visual chaos. Skip the vanity metrics too (like total page views when you really care about conversions). I've seen so many teams get obsessed with impressive-looking numbers that don't actually help them make decisions. Your KPIs should tie back to real business goals, not just whatever's easiest to track. Oh, and think about who's using it - your CEO needs different info than your marketing team. Start small with maybe 3-5 metrics. You can always add more later once people actually start using it regularly.
So KPI dashboards are pretty clutch - they show each team exactly what they need to know for their decisions. Your execs can catch revenue trends early and shift strategy. Meanwhile, managers are using operational stuff to fix bottlenecks or move resources around daily. Honestly, it's wild how much clearer everything becomes when you're not just winging it anymore. The trick is customizing what people see - otherwise they'll drown in useless data. Figure out what decisions each person makes regularly, then build around that. Way more effective than showing everyone the same generic metrics.
So basically it comes down to what timeframe you're watching. Operational ones are for your daily stuff - website traffic, conversion rates, support tickets, that kind of thing. You're checking real-time data to catch problems fast. Strategic dashboards are different though - they track the big picture over months, like revenue growth or customer lifetime value. Executives love those for major decisions. Honestly? You probably need both, which sounds annoying but it's true. Just figure out if you need to babysit daily operations or measure progress on bigger goals first.
Honestly, monthly is a good starting point for most KPIs. But it really comes down to what you're actually measuring. Sales numbers or daily ops stuff? Check those weekly - things move fast there. Strategic metrics like customer satisfaction though? Those don't shift overnight, so quarterly works fine. I learned this the hard way when I was obsessing over brand awareness scores every week (total waste of time). Start monthly and see what feels right. You'll notice pretty quick which metrics need babysitting and which ones stay steady.
Oh man, this totally depends on what you do! Retail folks should watch conversion rates and inventory turnover - that stuff matters way more than follower counts. SaaS? Track your MRR and churn rate religiously. Manufacturing needs OEE and defect rates. Healthcare is all about patient satisfaction and readmission rates (which honestly makes sense). Financial services can't ignore loan defaults and compliance stuff. But here's the thing - don't track like 20 different metrics. Pick maybe 5-7 that actually tell you something useful about your business, not just numbers that sound cool in meetings.
Okay so basically KPI dashboards totally break down those stupid departmental walls. Marketing can actually see their leads turning into sales numbers. Customer service realizes their response times are directly hitting retention - mind blown, right? Once everyone's staring at the same data, they start talking to each other more. Like, who knew? The shared numbers just naturally get people coordinating instead of working in their own little bubbles. Set up monthly cross-team meetings around your dashboard data. Trust me, you'll discover collaboration opportunities that weren't even on your radar before.
Look, startups need totally different metrics than big companies. You're basically asking "will we die?" vs "how can we optimize?" For early stage - track your runway, user acquisition costs, and monthly recurring revenue. Retention rates too since that shows if people actually want your product. I've watched so many founders get obsessed with downloads or page views when their bank account is what really matters. Bigger companies can dive into customer lifetime value, market share, all that complex stuff. They've got the luxury of time. Stick to 3-5 metrics max that actually answer whether you're growing fast enough to survive. Cash flow beats vanity metrics every time.
-
Crisp and neat slides. Makes it fun and easier to curate presentations.
-
“The presentation template I got from you was a very useful one.My presentation went very well and the comments were positive.Thank you for the support. Kudos to the team!”