

Net promoter score powerpoint presentation slides




Try Before you Buy Download Free Sample Product
 Impress Your
 Audience
 100%
100% Editable
 Save Hours
 of Time


To measure and enhance your customer success all you need an influential tool for your business known as NPS, hence we offer you a net promoter score PowerPoint presentation slides which will help in retaining and minimizing the customer churn rate for your business. Utilize this presentation slide to define what NPS actually is for your business with its relevance and significance for the business growth and development. You can also use this PowerPoint image to explain the concept of customer success management which involves a process of keeping your clients happy through the metric of Net promoter score. With this presentation layout, measure whether your customers will recommend your business product or service to the other customers or not. Hence start commencing through this net promoter score PowerPoint template to describe the concept for better understanding of your potential viewers. Folks come closer with our Net Promoter Score Powerpoint Presentation Slides. They become extremely cohesive.
People who downloaded this PowerPoint presentation also viewed the following :
Content of this Powerpoint Presentation
Slide 1: This is an introductory slide to Net Promoter Score. State your company name here and get started.
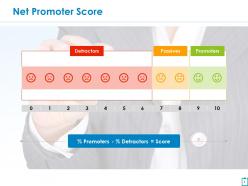
Slide 2: This slide states Net Promoter Score with the following parameters- Detractors, Passives, Promoters. Use these parameters to assess Net Promoter Score.
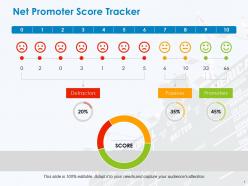
Slide 3: This slide showcases Net Promoter Score Tracker. Track your score here.
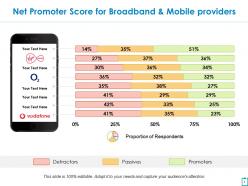
Slide 4: This slide showcases Net Promoter Score for Broadband & Mobile providers in percentage.
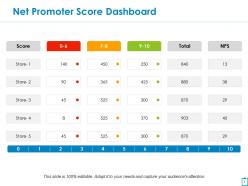
Slide 5: This slide showcases Net Promoter Score Dashboard.
Slide 6: This slide is titled Coffee Break to halt and then proceed further. You may change the slide content as per need.
Slide 7: This slide is titled Charts and Graphs. You may change the slide content as desired.
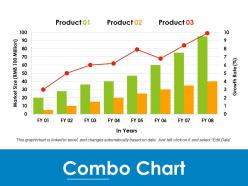
Slide 8: This is a Combo Chart slide to show information, comparison specifications etc.
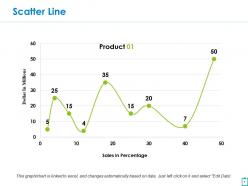
Slide 9: This is a Scatter Line chart slide to show information, comparison specifications etc.
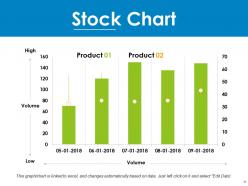
Slide 10: This is a Stock Chart slide to show information, comparison specifications etc.
Slide 11: This slide is titled Additional Slides to move forward. You can change the slide content as per need.
Slide 12: This slide showcases Our Mission. State your company mission and goals here.
Slide 13: This slide showcases Our team with name, designation and image boxes.
Slide 14: This is an About Us slide. State team/company specifications here.
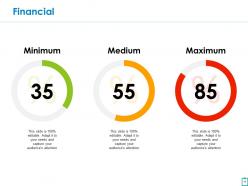
Slide 15: This is a Financial score slide. State financial aspects, information etc. here.
Slide 16: This is a Quotes slide to show something you want to convey. You may change the slide content as required.
Slide 17: This is a Bulb & Idea image slide to show ideas, innovative information etc.
Slide 18: This is a Thank You slide with Address# street number, city, state, Contact Numbers, Email Address.
Net promoter score powerpoint presentation slides with all 18 slides:
Build belief that you can do it with our Net Promoter Score Powerpoint Presentation Slides. They are equipped with all the facilities.







FAQs for Net promoter score
Okay so NPS is pretty simple - you ask customers "How likely are you to recommend us to a friend?" on a 0-10 scale. Anyone who picks 9-10 is a "Promoter," 7-8 are "Passives," and 0-6 are "Detractors." Here's the weird part though - you completely ignore the Passives in your math. Just take your percentage of Promoters minus percentage of Detractors. If 50% are Promoters and 20% are Detractors, boom, you've got an NPS of 30. The whole thing runs from -100 to +100, and honestly anything above zero means you're doing alright.
Keep those NPS surveys short and time them right - like right after someone buys something or deals with support. The timing makes a huge difference. Ask the usual "how likely are you to recommend us" but always throw in a "why" question after. That's where the good stuff is. Don't spam everyone at once though - space it out by different customer groups. Oh, and this should be obvious, but actually do something with the feedback. People notice when you ignore their responses. I'd start with just one touchpoint first, get that working smoothly, then expand from there.
So basically it's a 0-10 scale for how likely people are to recommend you. Promoters (9-10) are your best friends - they'll actually tell others about you. Detractors (0-6) are the angry ones who trash-talk you online. Then there's the passives (7-8) who are... well, just there. They're satisfied but won't go out of their way for you. Here's what's funny though - everyone obsesses over the promoters and detractors, but passives are where the real opportunity is. Way easier to bump someone from an 8 to a 9 than turn a detractor around, you know? I'd focus your energy there first.
Quarterly is usually your sweet spot for NPS surveys. Gives customers enough breathing room so they don't get annoyed, but you'll still catch real changes in how they feel about you. Some people do monthly but honestly? That feels excessive unless you're like a startup pivoting every other week or something. The timing consistency matters way more than frequency anyway - you need that to spot actual trends. When we started doing this, quarterly worked great with maybe a quick one-question pulse every month and a half. Just don't overthink it and stick with whatever schedule you pick.
NPS is actually pretty useful for figuring out your next moves. Look at which customers are your biggest fans and double down on keeping them happy. The detractors? Yeah, those need fixing ASAP. Comments from surveys will show you exactly what's broken - could be your product, service, whatever. I mean, it's literally telling you if people would recommend you or trash-talk you to friends. Break down your scores by customer type or product line first. You'll spot patterns that way. Then use those insights to decide what features to build next or if your pricing is off.
Oh totally, cultural differences mess with NPS big time. Germans and Japanese folks are way more conservative with their ratings - they'll love your product but still give you a 7. Meanwhile other cultures go all-in with 9s and 10s for anything decent. Some places just hate using extreme scores period, which is honestly super frustrating when you're trying to measure satisfaction. I learned this the hard way at my last job. Don't compare your German scores to your Brazilian ones - you'll think you're failing when you're not. Benchmark locally instead.
Don't treat NPS like it's some magic number that tells the whole story. High score? Cool, but why? Low score? Figure out what's actually broken before you freak out. I've watched teams lose their minds over tiny monthly changes that don't even matter - focus on bigger trends instead. Comparing NPS across different customer groups is pretty useless too unless you factor in what else was happening. The real mistake though? Not following up with actual conversations. Those scores are meaningless without understanding what people are thinking.
Here's what I'd do with NPS - start with your detractors because they're about to bail anyway. Call them up, figure out what's making them miserable, then actually fix it. Your promoters though? Those people are basically doing your marketing for free, so hit them up for referrals or testimonials. Most companies just collect the scores and then... nothing happens. Big mistake. You've got to follow up fast - like within a day or two max. Oh, and track whether people actually move from hating you to at least being neutral. Otherwise you're just collecting data for no reason.
So here's the thing - your NPS is basically a mirror of how engaged your employees are. Happy workers genuinely care about helping customers, which shows. They'll actually solve problems instead of just going through the motions. Miserable employees? Customers pick up on that vibe instantly. I've seen this play out at every company I've worked at, honestly. Track both metrics at the same time and you'll spot the pattern pretty quick. Work on getting your team more invested in their jobs first - the customer satisfaction scores usually improve on their own after that.
Honestly, just Google "[your industry] NPS benchmark 2024" first - that'll get you started. Companies like Bain and Qualtrics put out annual reports broken down by sector. Most industries sit somewhere between 0-50, but there's crazy variation. Software companies might hit 30+, airlines barely scrape 10 (no surprise there). Don't stress too much about hitting exact numbers though. Sample sizes are all over the place and methodologies vary. Your quarter-over-quarter trends matter way more. Also check if your trade associations publish any customer experience stuff - sometimes they have better data than the big consulting firms.
Get back to people within 24-48 hours, especially the unhappy ones (scores 0-6). Write real responses that actually address what they said - don't just copy-paste generic stuff. Thank your promoters (9-10s) and maybe ask if they'd leave you a review. The middle group is tricky but worth it since they're so close to loving you. Just be genuine about it, you know? Nobody wants to deal with robotic customer service nonsense. Oh, and circle back in a month or two to show you actually did something with their feedback - people appreciate that more than you'd think.
Your detractors will literally tell you what's broken - that's pure gold for deciding what to build next. Promoters show you what's actually working, so don't go "fixing" stuff that users already love. I'd set up a system where your product team reviews NPS comments regularly, not just the scores themselves. Follow up with people to get the real story behind their rating. When you combine those insights with your usage data, you get both sides of the coin - what people are doing AND why they feel that way about it. Makes roadmap decisions way less of a guessing game.
I'd definitely check out Delighted, AskNicely, or Wootric first - they're solid for automating the whole process. You can set up surveys to trigger automatically through email, SMS, or right in your app based on whatever timing makes sense. The dashboards are actually pretty decent too, showing trends and breaking down responses without you having to crunch numbers manually. Oh, and the sentiment analysis on comments is clutch. If you're already using HubSpot or Salesforce, they've got NPS stuff baked in which might be easier than adding another tool. I'd just pick whatever plays nice with what you're already using.
The real value is in those written comments - that's where you'll find out why people are giving you 7s instead of 9s. Like, your numbers might look mediocre, but then you read the feedback and realize it's all about your checkout being a nightmare, not your actual product. I'd start grouping those comments into themes (you'll see the same complaints pop up over and over). Short answer: numbers show you have a problem, but the text tells you exactly what to fix. Way more actionable than just staring at scores, honestly.
Look, a good NPS is basically free marketing. Happy customers refer people without you asking, and honestly? Those referrals convert way better than cold leads. Your promoters also spend more and complain less about pricing - meanwhile detractors just suck up support resources. Here's the thing though - you catch problems early when you're tracking this stuff regularly. Fix issues before they blow up into expensive messes. Companies with strong NPS scores usually see 2-3x better revenue growth. I'd start checking monthly and actually respond to people who fill it out. That follow-up makes a huge difference.
-
Awesome use of colors and designs in product templates.
-
Much better than the original! Thanks for the quick turnaround.