

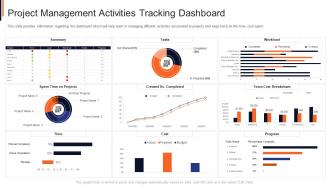
Project management activities tracking dashboard project safety management it





Try Before you Buy Download Free Sample Product
 Impress Your
Audience
 100%
Editable
 Save Hours
of Time


This slide provides information regarding the dashboard which will help team in managing different activities associated to projects and keep track on the time, cost spent.
People who downloaded this PowerPoint presentation also viewed the following :
Project management activities tracking dashboard project safety management it with all 7 slides:
Use our Project Management Activities Tracking Dashboard Project Safety Management It to effectively help you save your valuable time. They are readymade to fit into any presentation structure.






FAQs for Project management activities tracking dashboard project
Definitely start with timeline stuff and budget tracking - that's what everyone cares about first. Task completion and who's drowning in work next week are must-haves too. Oh, and resource allocation because nobody likes getting blindsided by scheduling conflicts. Risk indicators matter way more than those fluff metrics that look pretty but tell you nothing useful. Honestly, I'd focus on upcoming deadlines and blockers since those actually need action. The goal is a quick health check without scrolling through twenty different reports. Build from there based on what people keep bugging you about.
Honestly, dashboards are game-changers for cutting down on those annoying "hey, what's the update?" messages that fill your inbox. Everyone can just check the status themselves instead of bothering you constantly. Real-time updates mean no more chasing people down for progress reports. Stakeholders get the info they need without you creating a million different reports - seriously saves so much time. The visual setup makes it super easy for non-tech people to understand what's actually happening. Oh, and set up auto notifications so people get alerts when stuff changes or goes wrong.
Honestly, start with the basics - project progress percentage, budget vs actual spend, and timeline status. Resource utilization is huge too. I always add risk indicators because catching problems early literally saves your sanity. Task completion rates and milestone tracking are must-haves, especially when stakeholders won't stop asking if you're on track (ugh). Team workload distribution helps spot bottlenecks before they wreck everything. Don't overthink it initially - these core metrics will cover most situations. You can always tweak things later once you figure out what questions keep popping up in meetings.
Dude, real-time data integration is seriously worth it. You'll catch problems while you can actually fix them instead of finding out your project's been a trainwreck for three days. Budget issues, bottlenecks, missed deadlines - you see it all happening live. Way better than those soul-crushing Monday meetings where everyone pretends everything's fine. Your team stays on the same page automatically. Stakeholders get updates without you having to chase people down constantly. Oh, and set up alerts for the big stuff so you're not obsessively checking dashboards all day like I used to do.
Just focus on the stuff your team checks every day - project status, deadlines, blockers. That's it. Color coding is your friend (red/yellow/green) plus progress bars so people can glance and move on. I swear, most dashboards I've seen are total disasters because they cram in everything. Put your most important metrics at the top where you don't have to scroll. Group similar things together - seems obvious but you'd be surprised. Oh, and definitely test it with a couple teammates first. They'll roast you if it's confusing, which honestly saves you later.
So basically every industry builds dashboards around what actually drives their business. Construction folks track progress photos and weather delays - safety incidents too obviously. Healthcare's obsessed with patient outcomes and staying compliant. Tech companies go nuts with sprint velocity and bug tracking (sometimes way too many metrics honestly). Manufacturing watches production schedules and quality control super closely. The trick is figuring out what success looks like in your specific field, then what problems keep coming up. Build your dashboard around those pain points so you can spot issues faster and make smarter calls.
Honestly, visuals are a game-changer for project management. Your brain just processes images way faster than text - like, why read "stop" when you can see a red light, you know? I love using simple color-coded stuff like red/amber/green dots because you can instantly see what's broken versus what's cruising along. Progress bars and trend charts help too, especially for catching patterns you'd totally miss buried in spreadsheets. Start basic with RAG status indicators. Trust me, once you see everything laid out visually instead of digging through boring status reports, you'll wonder how you managed without it.
Honestly, dashboards are a lifesaver for this stuff. You'll see exactly who's swamped and who's got bandwidth in real-time. Like when one person is completely buried while others are just waiting around - those visual charts make it so obvious where things are unbalanced. I usually set up alerts when someone hits max capacity so you can shuffle things before it gets crazy. The best part? You can spot those patterns over time and actually plan better for next quarter. Oh, and definitely track utilization rates - sounds boring but it's super helpful for seeing the bigger picture.
So Microsoft Project, Asana, Monday.com, and Trello are your main options - Trello's great if you want something simple. Teams go crazy with all these bells and whistles when honestly? Basic stuff works just fine most of the time. Smartsheet and Wrike have better dashboards if that's what you're after. Oh, and don't sleep on just making something custom in Excel or Google Sheets if it's a smaller team. My biggest advice though - pick whatever actually fits how your team works now. You can always upgrade later once you figure out what you actually need.
So basically, predictive analytics turns your dashboard into something that actually sees around corners instead of just telling you what already happened. You get heads-up alerts about delays and budget issues before they blow up. The algorithms are surprisingly good at catching patterns we'd totally miss - they dig through all your old project data to predict where things might go sideways. Honestly beats the hell out of those endless "emergency" meetings where you're scrambling to fix stuff that's already broken. You can actually plan ahead for once and maybe even leave work on time occasionally.
Honestly, the worst thing you can do is throw every possible metric on there - it just becomes a hot mess nobody wants to look at. Skip the vanity stuff that looks cool but doesn't actually help anyone decide anything. I once watched someone spend three weeks on these gorgeous charts that the CEO literally glanced at for two seconds lol. Your data needs to be solid and fresh enough to matter. Different people need different things too - what works for product managers won't work for executives. Just start with maybe 5-7 things that really count, then see what people actually use.
Set up monthly check-ins to see what metrics your team actually uses vs. what sits there collecting digital dust. Most KPIs you think matter? They don't after week three, trust me. Ask your team what's missing and what's just taking up space on their screen. Retire the dead metrics, add new ones when priorities shift. I'd treat it like any recurring meeting - just schedule it. The whole thing should feel like a living document that actually evolves with your project, not some static thing you built once and forgot about.
For team collab stuff, definitely get real-time commenting and @mentions working first. Shared file storage is huge too - saves you from that "wait which version are we using?" nightmare. I'd set up activity feeds so people can actually see what's happening (way better than endless status meetings). Task assignments with clear owners help a ton, plus progress tracking. Oh and the chat features are honestly a lifesaver for quick questions. Just don't go crazy with notifications or your team will hate you!
Dude, mobile access is honestly a total game changer. People can check project updates and handle tasks while they're grabbing coffee or stuck on the train - way better than being glued to their desk all day. Our team actually stays connected now, which is kinda nice? Decision-making gets way faster too since stakeholders can approve stuff right away instead of making everyone wait. Just make sure the dashboard actually works on phones though. Those tiny buttons are the worst - learned that one the hard way.
Start with an access audit - you'll probably find people have way more permissions than they need. Role-based access is key so junior folks can't accidentally touch budget stuff or client data. Everyone thinks their passwords are bulletproof, but honestly? They're not - so definitely add multi-factor auth. Watch those third-party integrations too since they love creating surprise security holes. Your dashboard provider better be encrypting everything both when it's moving around and sitting in storage. Oh, and don't forget to actually check who can see what right now.
-
Awesome use of colors and designs in product templates.
-
Professional and unique presentations.
-
It saves your time and decrease your efforts in half.
-
Very unique and reliable designs.