Project management monthly growth dashboard slide2 ppt powerpoint presentation file outfit

Project management monthly growth dashboard slide2 ppt powerpoint presentation file outfit
Slide 1 of 5
Favourites Favourites

Try Before you Buy Download Free Sample Product

Audience Impress Your
Audience
Editable 100%
Editable
Time Save Hours
of Time
The Biggest Sale is ending soon in
0
0
:
0
0
:
0
0
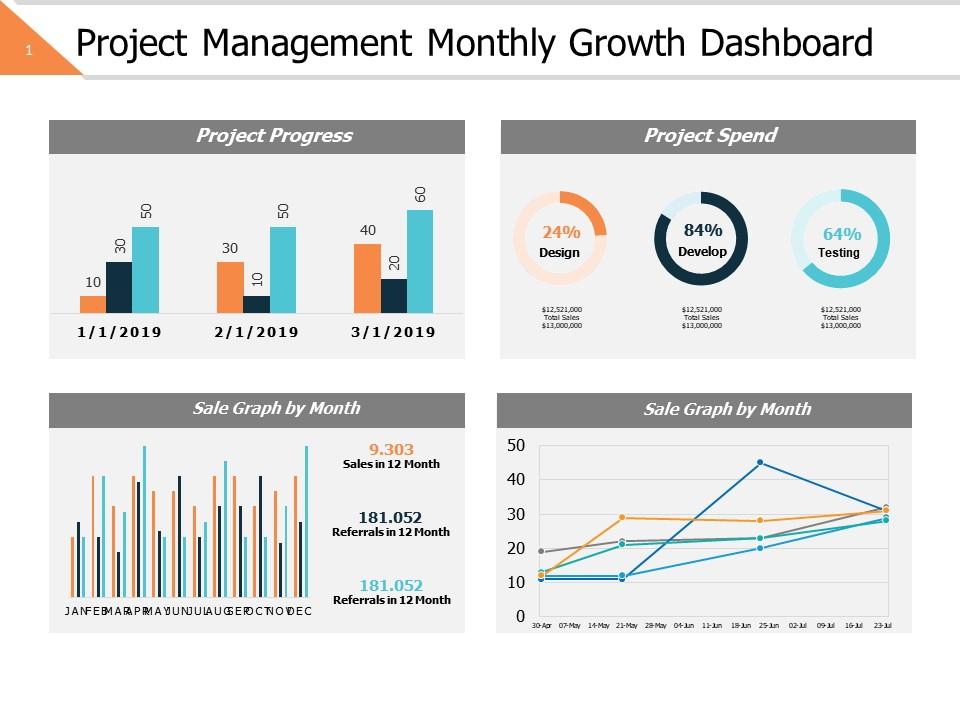
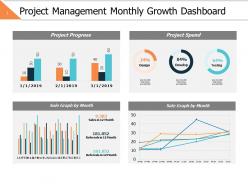
Presenting this set of slides with name - Project Management Monthly Growth Dashboard Slide2 Ppt Powerpoint Presentation File Outfit. This is a four stage process. The stages in this process are Business, Management, Strategy, Analysis, Finance.

FAQs for Project management monthly growth dashboard slide2 ppt powerpoint

So you need five main things: timeline with milestones, budget tracking (planned vs actual), task progress showing who owns what, and risk alerts. Resource allocation matters too - can't tell you how many projects I've watched implode because someone was triple-booked and nobody caught it. Your dashboard should show team capacity at a glance. Keep everything visual and scannable - if you're clicking through multiple tabs to check project health, you're doing it wrong. Start with these basics, then add whatever your stakeholders keep bugging you about in meetings.

Honestly, dashboards are a game changer for keeping everyone on the same page. No more constant "hey what's the update on X?" Slack messages every five minutes. You can actually see who's doing what and when stuff's due without having to hunt people down. Real-time updates mean nobody's working off old info anymore - which used to drive me crazy at my last job. The key is putting your most important project stuff right up front where everyone can see it. Way fewer pointless status meetings too. Just make sure people actually use the thing or it's useless.

Start with the basics - project progress percentage, budget vs actual spend, timeline stuff, and how you're using your resources. Milestone completion is huge too. Oh, and risk indicators literally saved me on the Henderson project when we spotted scope creep early. Quality metrics matter - defect rates, client satisfaction scores, that kind of thing. Team workload distribution so nobody burns out. Keep it visual with charts and color coding because honestly, who has time to dig through spreadsheets? Start with maybe 6-8 metrics max or you'll overwhelm everyone.

Honestly, you just gotta show people what they actually need to see. Execs want the big picture stuff - budget vs actual, are we on track, that kind of thing. Don't flood them with task-level details (learned that lesson the hard way lol). Your team needs the nitty gritty though - who's doing what, what's blocked, deadlines coming up. Clients? They care about milestones and deliverables, not your internal mess. Most tools let you create different views for different roles. Ask each group what decisions they're making with the data first. Then just surface those specific metrics. Way cleaner that way.

Honestly, good data viz is a game changer for projects. Raw spreadsheets are the worst - who wants to hunt through rows of numbers when you're trying to hit deadlines? Charts and dashboards let you see problems instantly. Color-coded stuff, progress bars, the works. You'll spot bottlenecks before they become disasters. The trick is focusing on metrics that actually matter for your daily decisions, not just pretty graphs that look impressive. I learned this the hard way on my last big project.

Dude, real-time data is seriously worth it. You'll actually know what's happening with your projects right now instead of working off old info. Bottlenecks become obvious before they wreck everything, and you can catch budget issues early. Your stakeholders stop bugging you constantly since they can just check the dashboard themselves - honestly that alone makes it worthwhile. Set up alerts for the important stuff so problems hit your radar automatically. Way better than waiting around for monthly reports that are already outdated by the time you read them.

Start with the basics - project status, deadlines, and who's working on what. Visual stuff works way better than paragraphs nobody reads. Progress bars, color coding, simple charts. I swear half the dashboards I've used look like someone just dumped every possible number on one screen - total nightmare. Your CEO needs different info than project managers, so build in some customization. Oh, and definitely test it with real people first. What seems obvious to you might make zero sense to everyone else. Trust me on that one.

Honestly, dashboards are game-changers for catching problems early. I track maybe 4-5 key things - budget burns, milestone slips, that kind of stuff. Way easier than hunting through endless Excel files (which I still do too much of). The visual aspect is clutch because you'll immediately notice when trends go sideways. Set up some basic alerts so you're not constantly checking manually. Resource bottlenecks are usually the first red flag I watch for. Once you nail down your main risk indicators, build simple widgets around those. Don't overcomplicate it at first.

Monday.com and Asana are solid choices - Trello too if you want something dead simple. Microsoft Project's overkill unless you're managing crazy complex stuff. Our whole team basically lives in Notion now, which is weird because I used to think it was just for note-taking, but their dashboard features are actually pretty decent. Power BI and Tableau crush it for data viz if you've got the budget. My advice? Don't overthink it. Grab free trials of like 2-3 tools and test them on a small project first. You'll know pretty quick which one doesn't make you want to throw your laptop out the window.

Honestly, your dashboard needs to completely change as you move through project phases. Planning phase? Focus on milestones, resource allocation, and risk stuff. Once you're actually executing though, flip everything to real-time metrics - budget burn, workload distribution, task completion rates. That's what actually matters when things get hectic. Forget the theoretical timelines at that point. I'd customize your widgets for each phase instead of trying to make one dashboard work for everything (spoiler: it won't). Just think about what questions you're constantly asking, then build around those. Way more effective than generic setups.

Honestly, stale data will be your biggest headache. Team members just forget to update their progress - or they rush through it and mess up the info completely. Your dashboard becomes useless if the data sucks, so automate whatever you can and make manual updates super simple. Different tools not talking to each other creates duplicate entries too, which is annoying. Set up validation checks that actually catch errors. The key thing? Don't make updating feel like a chore or you'll spend forever chasing people down instead of managing anything productive.

Dude, mobile dashboards are honestly a lifesaver for remote teams. Your people can update tasks and check project status right from their phones - no more waiting around for someone to boot up their laptop. Quick approvals happen during coffee breaks, blockers get solved faster. We're all on our phones constantly anyway, might as well use them for work stuff. Turn on push notifications for urgent updates and watch how much smoother everything runs. It's wild how much faster projects move when info doesn't just sit there waiting for people to get back to their desks.

Get them involved from day one - seriously, people hate stuff they didn't help build. Ask what numbers actually matter to them first, then make those the main focus. Each group needs their own view with just their KPIs, not some crazy overwhelming mess. Demo it with their real project data so they can see the point. Here's what I've learned though - if it doesn't save them time or fix something annoying, they won't use it. Period. Schedule quick weekly touchbases at first to catch problems early. Trust me on this one.

So AI can really help with project dashboards in a few solid ways. Predictive analytics will spot delays and budget issues before they blow up on you. Plus the automated risk detection catches stuff you'd probably miss otherwise. Smart scheduling is where it gets interesting though - it handles resource allocation and tweaks timelines based on your team's actual capacity and past project data. Oh, and the machine learning personalizes everything to your role with better alerts. Honestly feels like having a project assistant that actually knows what they're doing. I'd start with dashboards that already have AI baked in, especially the resource forecasting ones.

Honestly, dashboards are a game-changer for Agile teams. You get everything in one spot - burn-downs, story points, blockers - instead of clicking through five different apps (which drives me nuts). Daily standups become way smoother when everyone can actually see the data. During retros, you're making decisions based on real metrics instead of just guessing what went wrong. Oh, and definitely set up auto-updates. Nobody wants to waste sprint time manually refreshing charts. The visual aspect really helps too - some people are just better at processing info that way.

Ratings and Reviews

0% of 100
Review Form
Write a review
Most Relevant Reviews

No Reviews